
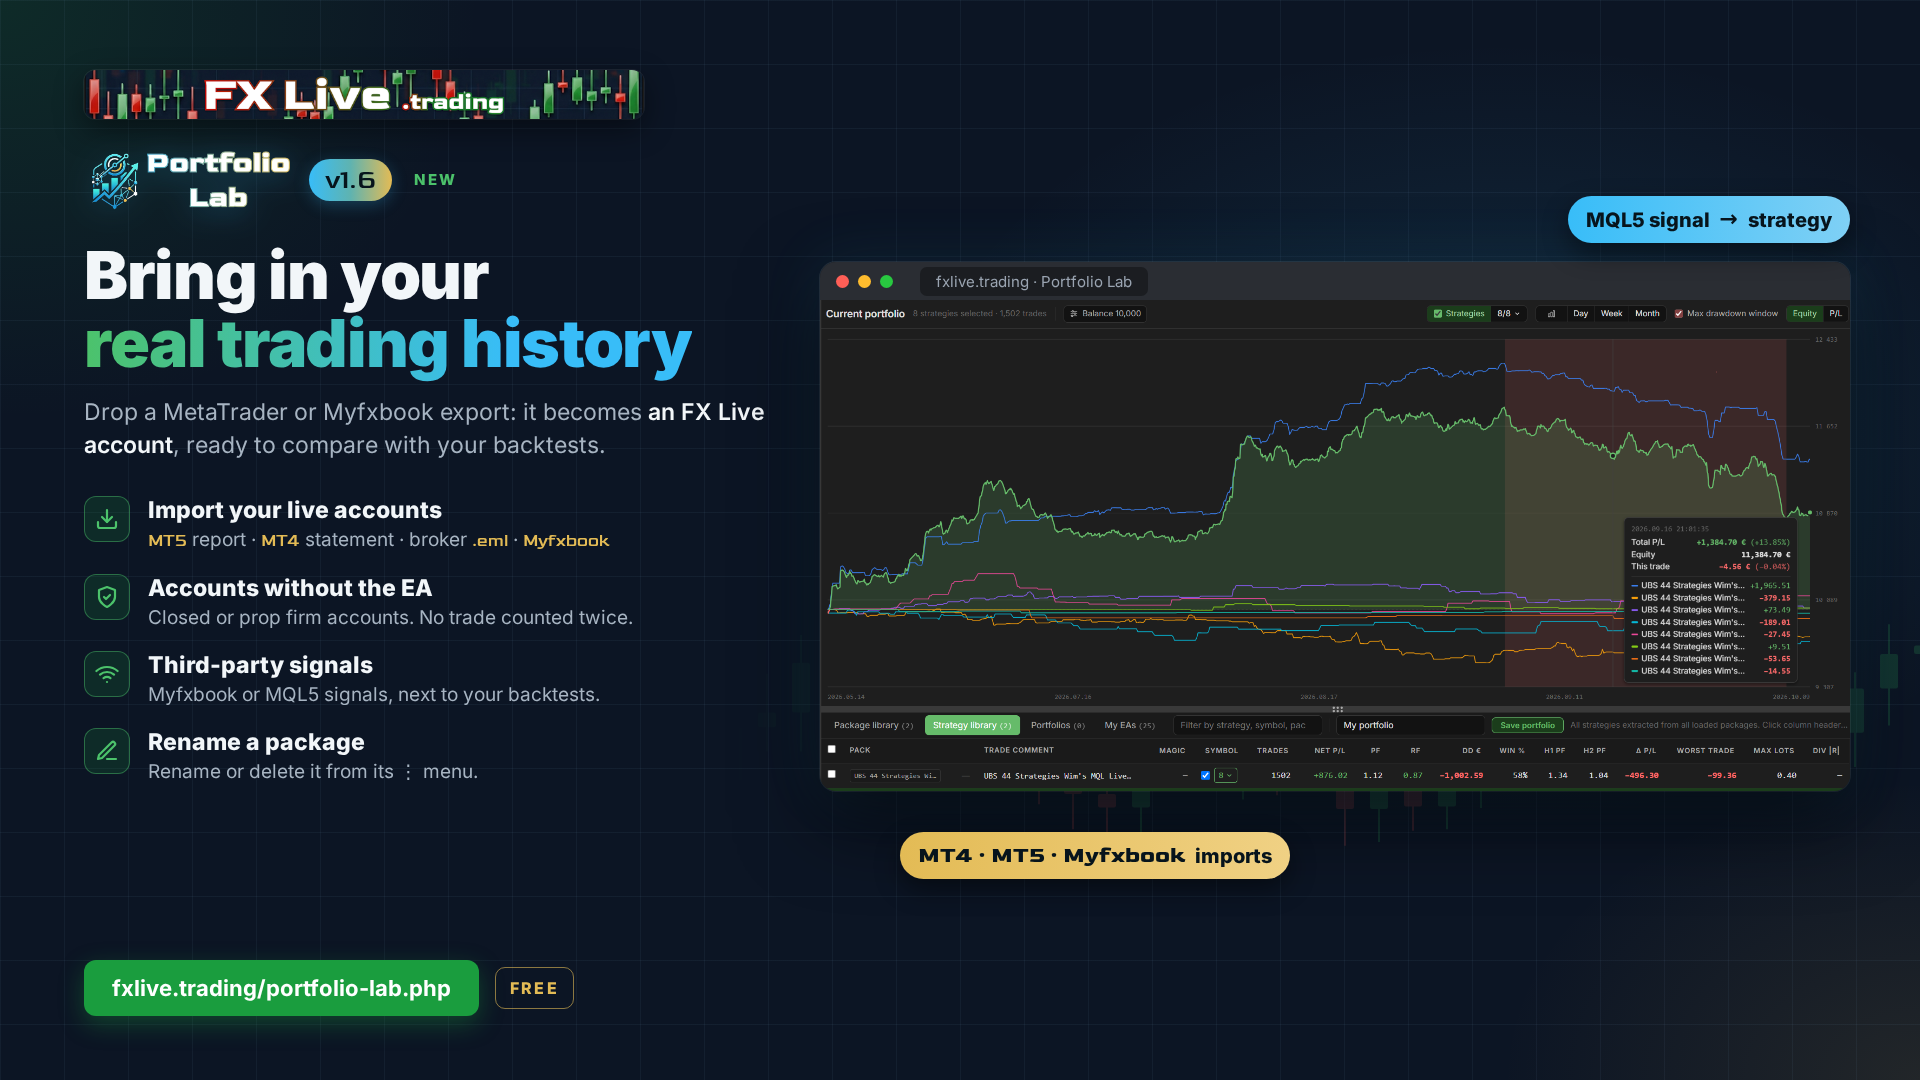
Portfolio Lab 1.6 goes beyond your backtests: it now also takes EA creators' signals and the history of your live accounts, so you can compare everything in one place.
Compare creators' signals with their backtests
Before buying or running an EA, one question always comes up: do the creator's live results look like the backtests? The Lab now takes the history of an MQL5 signal or a Myfxbook system, in two steps.
1. Download the signal's history
On the MQL5 signal page, Trading history tab, the Export to CSV: History link under the table saves all the signal's positions to a .csv file. On Myfxbook, a system's CSV history export works the same way.
2. Drop it into Portfolio Lab
Add package, then pick the file: the signal becomes a strategy in the library, just like a backtest.
- Its statistics (trades, P/L, PF, drawdown, win rate) and its breakdown by symbol.
- Its curve, and one curve per symbol, next to your backtests and your live EAs, in the chart, the correlation matrix and the calendar.
Rename your packages
A file name is not always meaningful. In the Package library, the ⋮ button at the end of each row now offers Rename and Delete. Type the new name straight into the row; it follows everywhere: strategy library, chart and saved portfolios. Thanks to the member who suggested it!
Your MetaTrader and Myfxbook histories become FX Live accounts
Drop the history report of an MT5 account, the detailed statement of an MT4 account, the statement your broker sends by e-mail or the Myfxbook export of an account: the Lab recognises it and turns it into an FX Live account, with its statistics, detail page and EAs. Ideal for a closed account, a prop firm account or an account without the Stats Export EA. If the EA takes over later, it completes the same account without counting anything twice. Same entry from the My accounts page, "Import a history" button.
When the import is done, the EAs found in the comments and magic numbers of the positions are suggested to you: tick the ones you want, they are created and ready to compare in the Lab.
Your feedback is always welcome, on Discord or at contact@fxlive.trading.
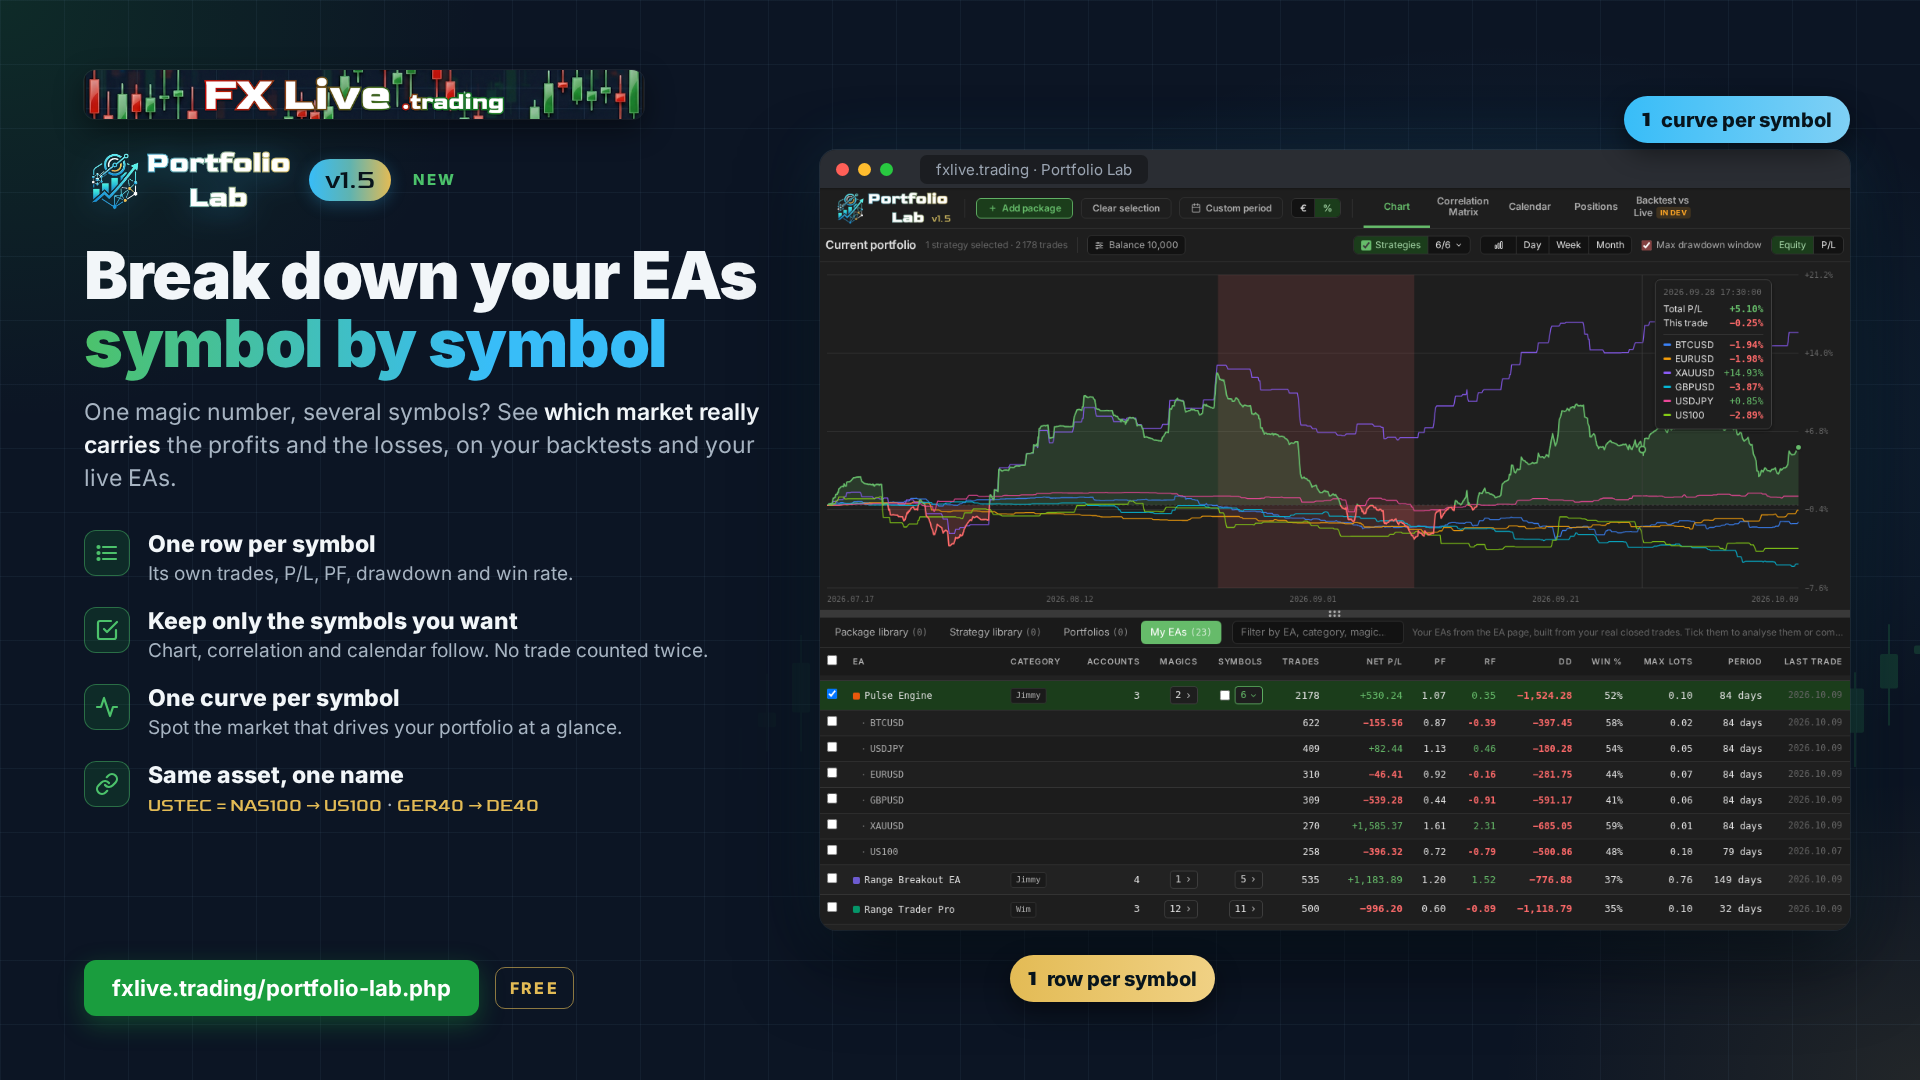
Many EAs trade several symbols with a single magic number. Portfolio Lab 1.5 finally breaks them down symbol by symbol.
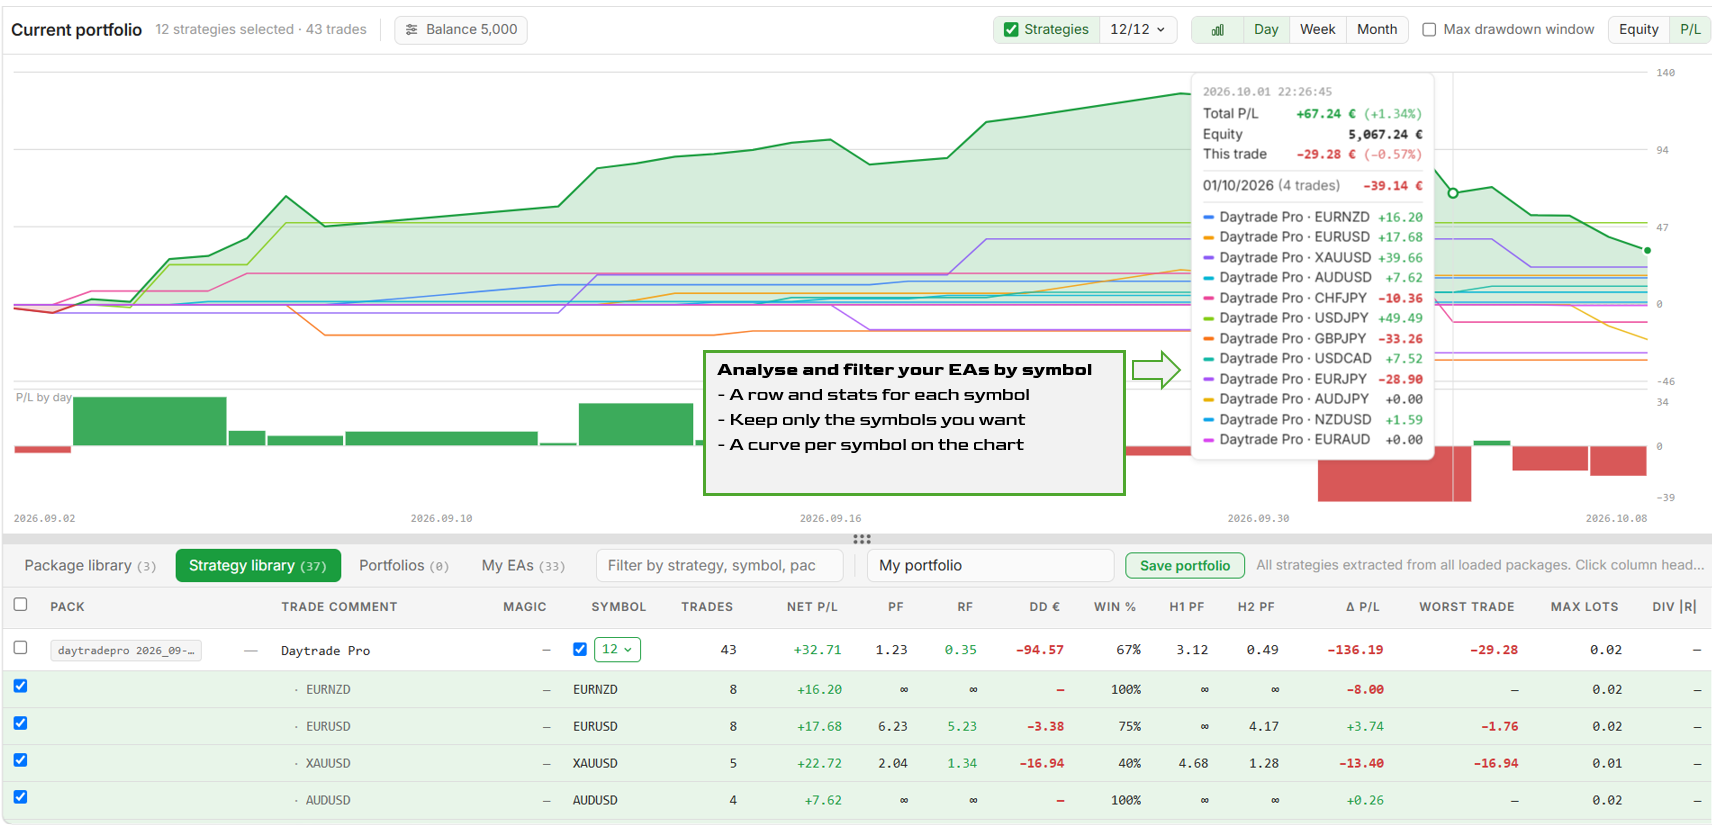
- One row per symbol, with its own stats, for your EAs, each of their magics and your backtest strategies.
- Tick only the symbols you care about and build, for instance, "Pulse Engine without NAS100". Chart, correlation and calendar follow, and a trade is never counted twice.
- One curve per symbol in the chart, to see at a glance which market carries the performance.
- Same asset, one name: USTEC, NAS100 → US100, GER40 → DE40, WTI → USOIL… Also on your account and portfolio pages, with the new button in the top bar.
Your feedback is always welcome, on Discord or at contact@fxlive.trading.
Two changes to keep an eye on your accounts without switching pages: your accounts' key figures in the side menu, and your brokers' limits and margin on the account and portfolio pages.
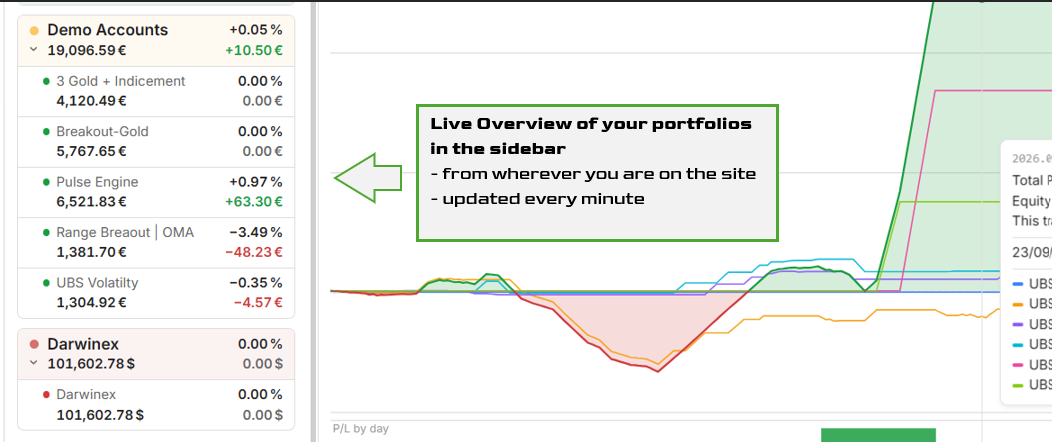
Your accounts, live, in the side menu
Each portfolio and each of its accounts shows its current drawdown in %, its balance and its floating P/L, on every page: Portfolio Lab, set file editor, statistics… Values update every minute, with the same figures as the dashboard.
- Upload status: the dot in front of each account turns orange after 15 minutes without an upload from the EA, red after an hour.
- On hover: equity, balance, margin level, open positions, today's result and last upload.
- Collapsible portfolios: the chevron under the colour dot keeps only the total; click the name to open the portfolio page.
- % mode: when you hide amounts, only the percentages remain, in green or red.
Your broker's limits, before they block your EAs
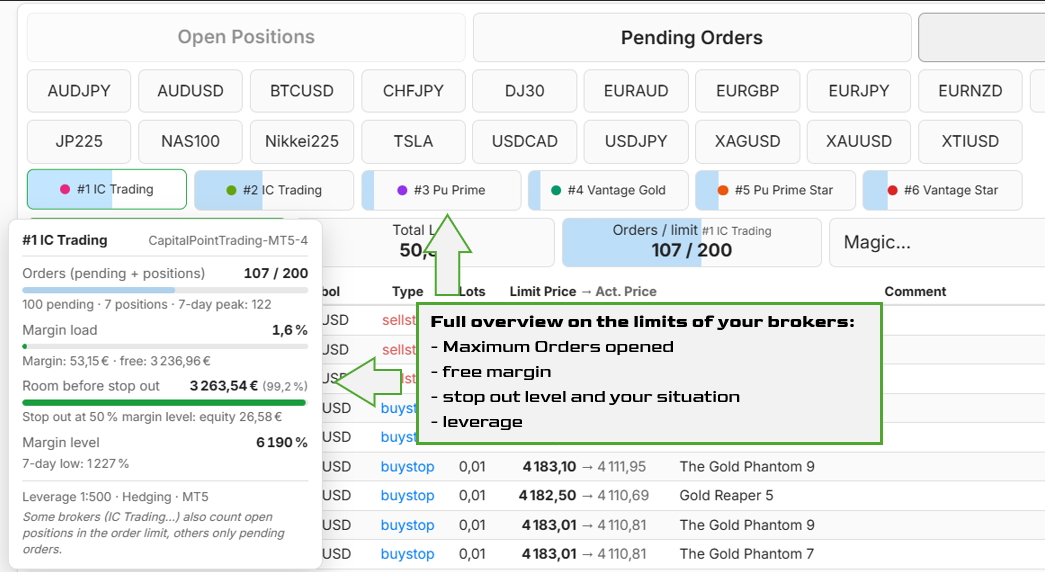
Brokers cap the number of pending orders per account (200 at some), and beyond that new orders are rejected without warning. The Pending orders tab now shows where each account stands:
- the account buttons become a limit usage gauge, orange at 70%, red at 90%;
- an Orders / limit box shows the account closest to its limit.
Some brokers also count open positions in that limit: the gauge includes them, to be safe.
Margin at a glance
Rest the mouse on an account button for a second: a tooltip sums up its orders against the limit, its margin load, the room left before stop out (amount and % of equity, based on your broker's stop out level), its margin level and leverage. The 7-day peaks (orders, lowest margin level) build up with each sync.
Exit slippage
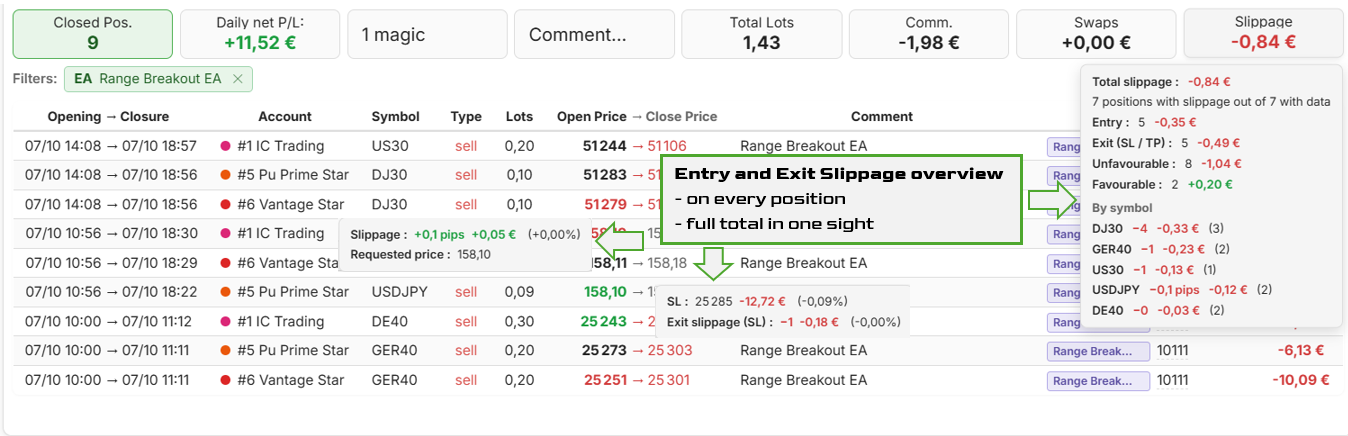
On top of opening slippage, positions closed by their SL or TP now show the gap between the targeted level and the price actually obtained, with the amount. That is often where slippage costs the most. The Slippage box adds entry and exit, with the details on hover, including your history.
And also
- A floating button, bottom right, takes you back to the open or closed positions in one click.
- When you filter from the list (EA badge, account), the page scrolls back up to the filters to show the filtered totals.
- The Comment column can show the name given to the magic in Magic Database (tag button in the top bar).
- The top block always stays visible and shrinks as you scroll; pinning the lists' controls becomes an option (pin button).
Your feedback is always welcome, on Discord or at contact@fxlive.trading.
The Portfolio Lab moves to version 1.4, with new ways to read your results over time.
P/L bars under the curve
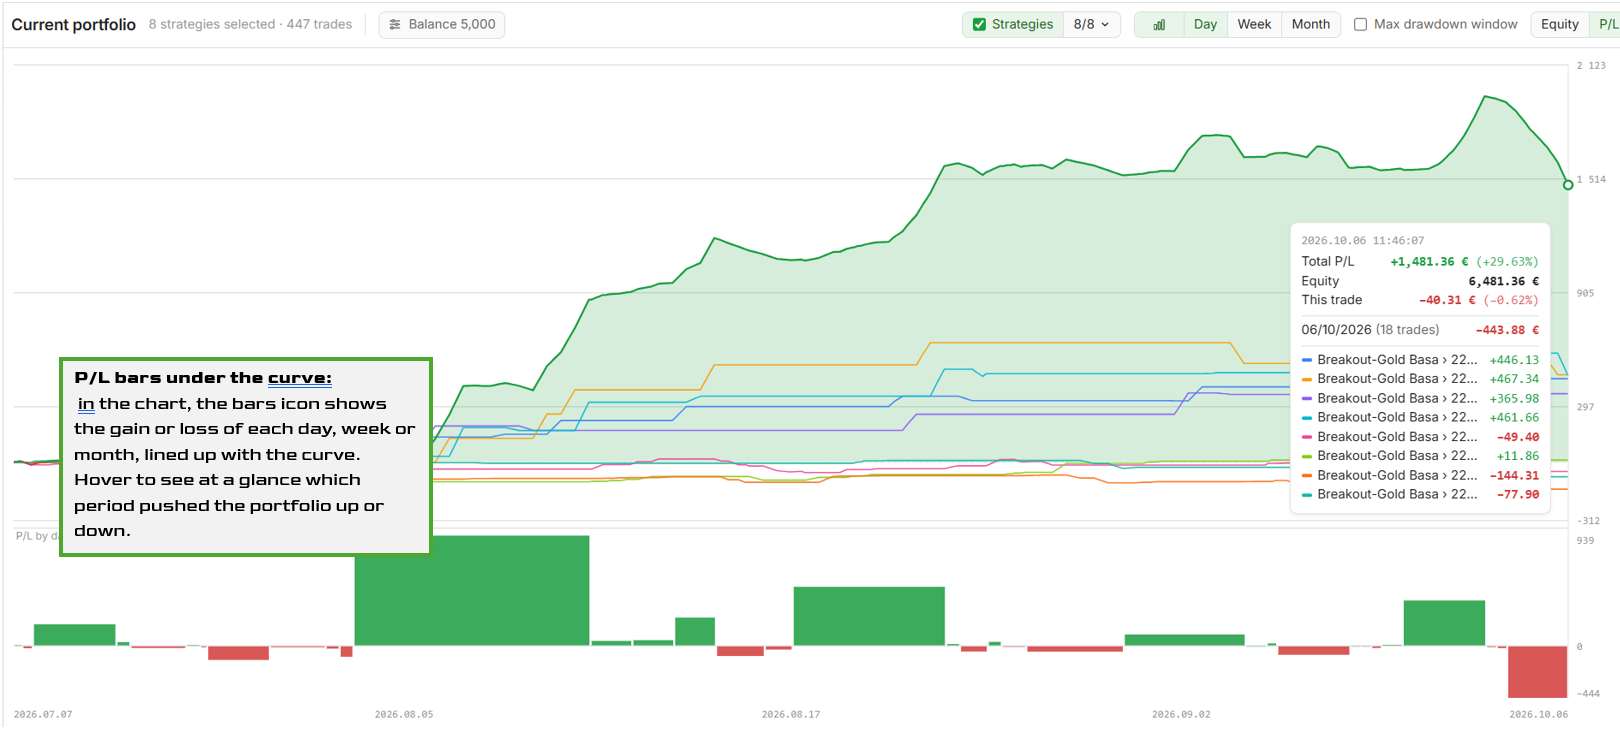
In the Chart tab, the bars icon shows the gain or loss of each day, week or month under the curve, lined up with it. The cursor runs through both: you see at once which period pushed the portfolio up or down.
Bar charts in the calendar
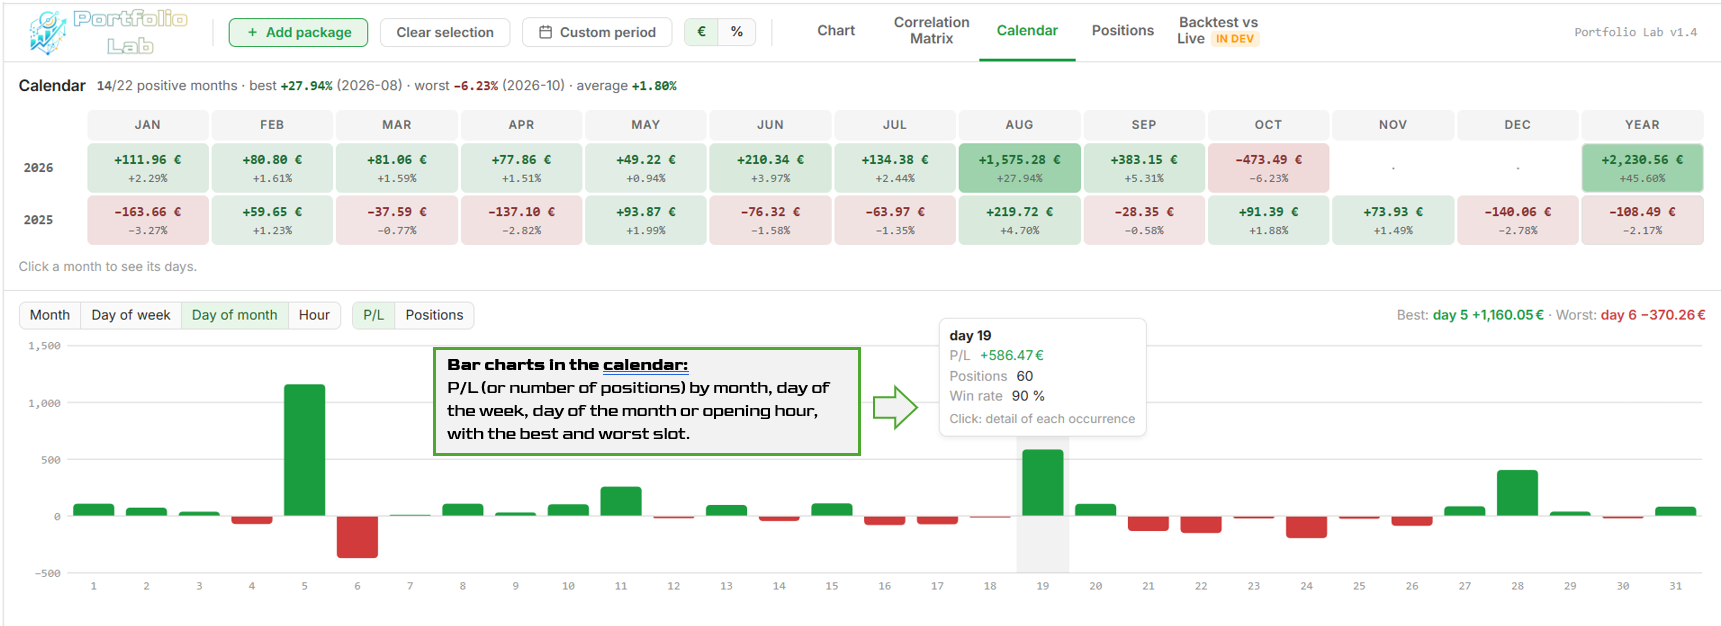
Under the calendar, the P/L or the number of positions by month of the year, day of the week, day of the month or opening hour, with the best and worst slot.
Is it consistent? Click a bar to see each of its occurrences: February year by year, every Monday, the 5th of every month… Is your best slot good every time, or did one exceptional period do all the work?
And also
- What If: fixed lot: the whole portfolio recalculated as if every position had been taken with the same lot, to compare your strategies at equal size.
- More room: the bottom panel collapses down to its tab bar (drag the splitter down or double-click it).
- Coming soon: Backtest vs Live. Does your live strategy do what its backtest promised? A preview is already visible in the Lab.
Your feedback is always welcome, on Discord or at contact@fxlive.trading.
The account and portfolio pages have been completely redesigned. They are now a single page: same layout, same tools, and much faster, even with more than a thousand positions on screen. The dashboard benefits too: it now updates by itself.
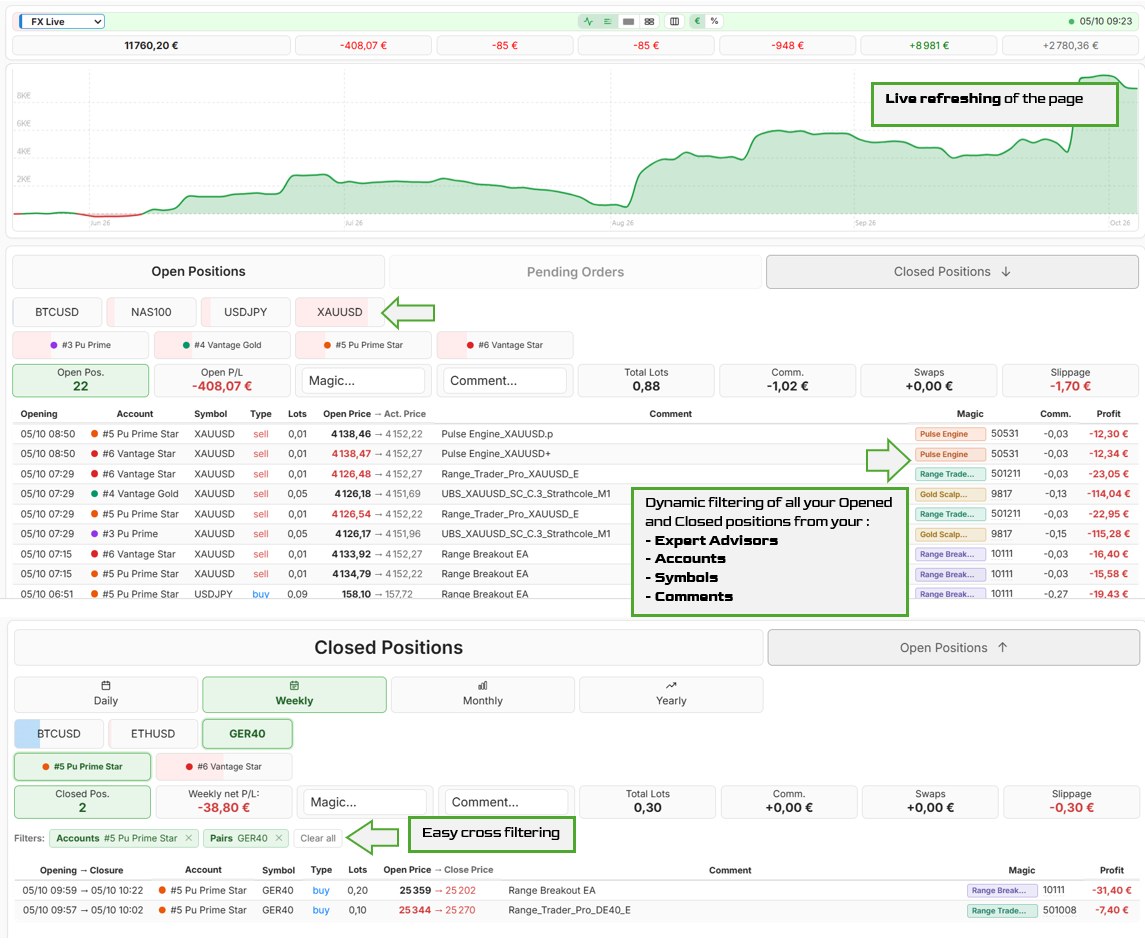
A toolbar at the top of the page
The whole top bar works as a drawdown gauge. It holds the portfolio picker, small buttons to show or hide the chart and the gauges, the Columns button, the € / % switch and, on the right, the upload status: the date of your EAs' latest upload, in orange after 15 minutes of silence and in red after an hour. Hover over it for the details, account by account.
The page refreshes automatically every 60 seconds while the tab is visible, without losing your filters. The figures follow your EAs' uploads, every 5 minutes by default.
The summary stays in view
On a large screen, as you scroll down the list of positions, the account block stays pinned at the top and shrinks to a single row of figures. The controls of each list (tabs, periods, pairs, accounts, summary) do the same, and the table header sticks right below: you filter and read the summary without scrolling back up. A pin in the top bar turns this mode off.
Columns your way
The Columns button opens the settings for open and closed positions side by side:
- SL and TP as columns, or grouped in the price tooltip to save space (this setting used to live on the dashboard);
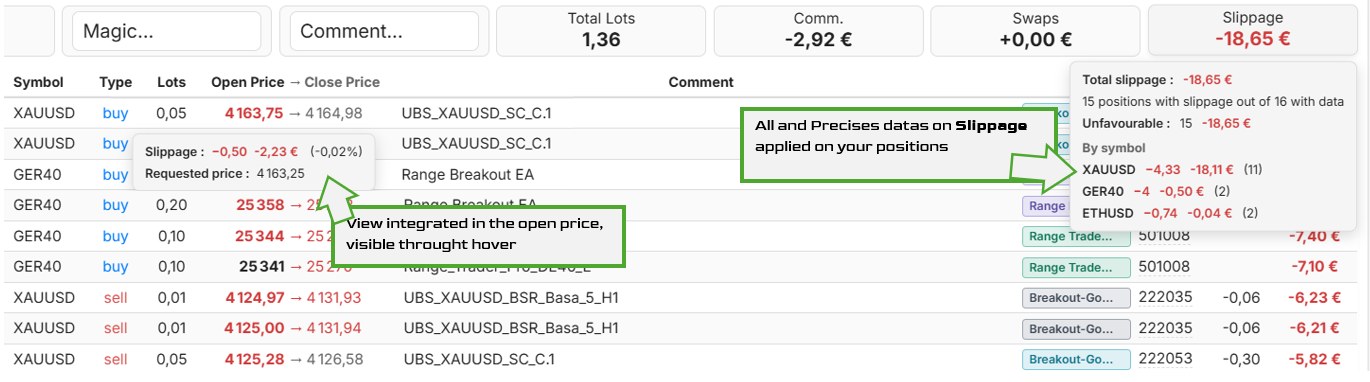
- slippage as a column, or when hovering over the open price, which then turns green or red;
- swap as a column, or added to the commission ("C+S" column);
- the other columns to show or hide: ticket, comment, magic, EA badge, account…
Slippage, finally in figures
A new Slippage box shows the total slippage of the positions on screen, in your currency. It follows all your filters (EA, account, symbol, period). Hover over it to see how many positions are affected, the favourable and unfavourable share, and a breakdown by symbol, in pips for forex.
Your EAs and accounts in colour
- Each position shows a badge with its EA's name and colour. Click it to filter the list on that EA. The magic number opens its positions in Statistics.
- On the portfolio page, a coloured dot marks each account. Click it to show only that account's positions.
- Colours are set in an EA's edit window and on the My accounts page. Without a setting, each one gets its own colour automatically. They also appear on the EA page cards and in the Portfolio Lab.
A dashboard that stays live
- The total block now uses the portfolio page's bar: drawdown gauge, small buttons (chart, hidden accounts, breakdown, account type, € / %) and upload status.
- It updates every 60 seconds, accounts included, without closing the blocks you have expanded.
- The "MT5 Live", "Demo"… badges can be hidden with one click.
- The broker's server name appears when you hover over the account number.
Faster
The pages have been gone over with a fine-tooth comb. A week of 200 positions now displays about three times faster than before, and the dashboard nearly twice as fast. Beyond 2,000 positions in a period, the page offers to open them in Statistics, which is built for large volumes.
Feedback is always welcome, on Discord or at contact@fxlive.trading.

The MetaTrader Setfile Editor moves to version 7.3. Two new features around a single parameter, the magic number: the editor spots duplicates across your files, and it now links up with the magic database of your FX Live account.
Duplicate magic numbers
Two strategies running with the same magic number means mixed-up positions and skewed statistics. It is a classic trap when you copy a setfile to make a variant of it.
- An alert appears as soon as several loaded files share the same magic number. Click it to jump to each of the cells involved.
- Duplicate cells are outlined in orange, with a "2×", "3×"… badge so you can see at a glance how many files are affected.
- Whatever the parameter is called: EA_MagicNumber, MagicNumber, InpMagic… The editor recognises it in every EA.
The bridge with your magic database
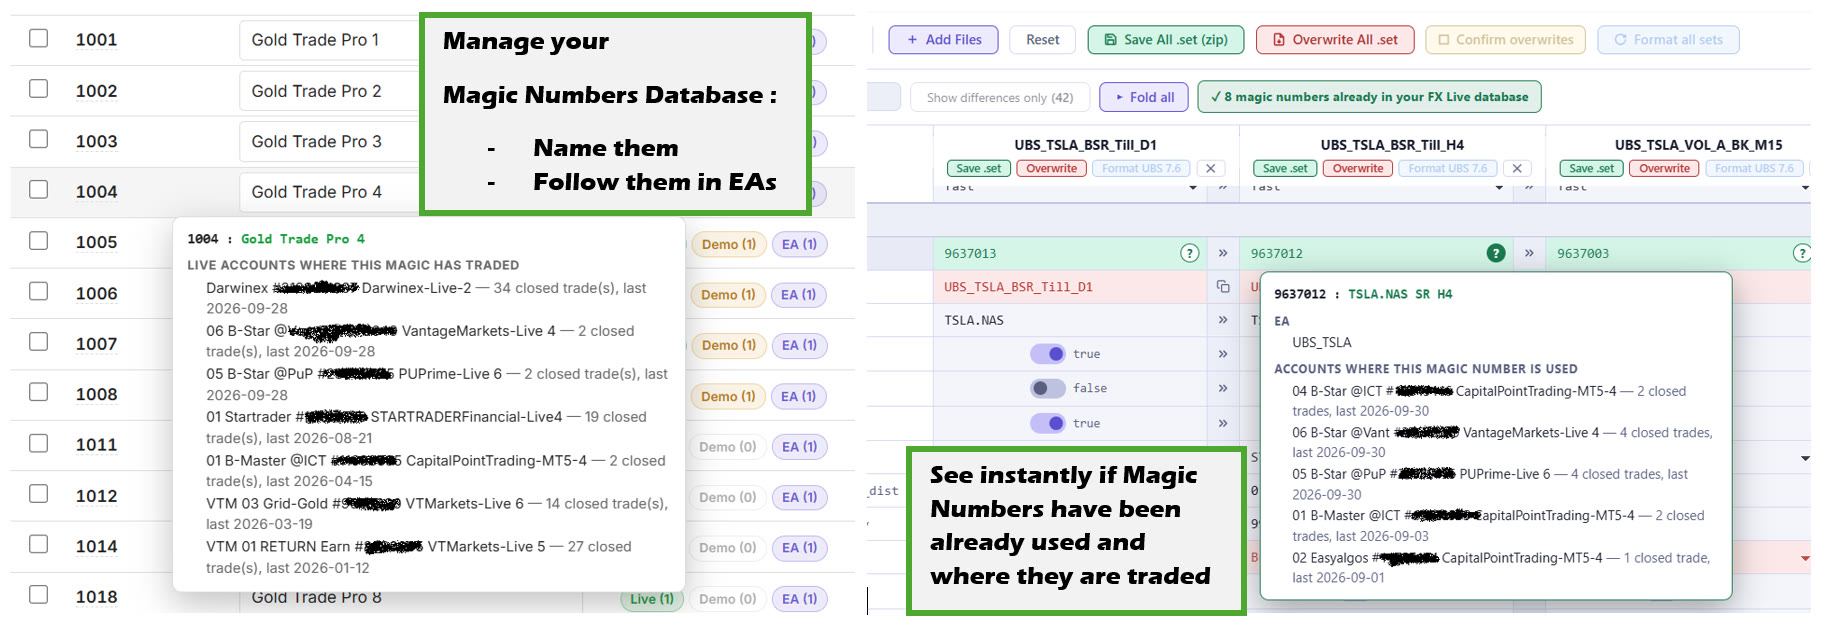
When you are signed in to FX Live, the editor checks the magic numbers of your files against the ones you already track. A green button shows how many are known, and their cells turn green.
Hover over a cell to see everything FX Live knows about that magic: the name you gave it, the EAs that use it and the accounts where it has traded, with its open positions, closed trades and the date of the last one. Before loading a setfile on an account, you know right away whether that magic has already been used, and where.
This information comes from the Magic Database page, where you name, group and archive your magics.
Give it a try
The Setfile Editor is free and runs right in your browser: your files never leave your computer. Duplicate detection works for everyone; the link with the magic database needs an FX Live account, which is free too.
Feedback is always welcome, on Discord or at contact@fxlive.trading.
The Portfolio Lab moves to version 1.3. On the menu: a new tab to explore every position of your portfolios, and a percentage view to read your results without revealing a single amount.
The Positions tab
Every position of the displayed portfolio, backtests and live accounts alike, in a single list: open and close time, duration, symbol, side, size, prices, P/L, cumulative, P/L %, comment, magic, account and source. The list stays smooth even with tens of thousands of positions, and every column sorts with one click.
- Quick filters: a search box (comment, symbol, magic, account…), All / Buy / Sell buttons and one button per pair.
- From the calendar to the positions: in the Month view, click a day or a week to open the positions of that period.
- SL and TP at a glance: the close price turns red when the SL was hit, green for the TP. Hover it for a tooltip with both levels and the gain or loss at each one.
For a package imported before this version, import it again to see the details of its positions.
Currency or percentage
A toggle in the top bar switches the whole display to %: the chart shows growth as a % of the starting balance, the calendar the % of each day, week, month or year, and the Positions tab the cumulative and net figures in %.
- Privacy: no amounts left on screen. You can share a screenshot of your results without revealing the size of your account.
- A more objective read: in percent, performance no longer depends on account size or lot size. Two strategies, two periods or two portfolios can be compared directly.
And also
More additions and improvements came with this version: a simpler period filter, filter boxes and checkboxes in every tab of the bottom panel, and one-click selection of all the strategies of an EA.
Your feedback is always welcome, on Discord or at contact@fxlive.trading.
A new version of the FX Live Stats Export EA is available on the MQL5 Market: v7.66 for MT5 and v7.65 for MT4. It measures the slippage at the opening of your positions and fixes data uploads on Windows systems set to another language. Slippage measurement only concerns MT5, which is why the MT4 version stays at 7.65; the site shows the expected version of each account based on its platform.
MT5 (v7.66) — Slippage at opening
Slippage is the gap between the price you asked for and the price you actually got. For every new position, the EA now sends the requested price, and FX Live computes the slippage from it. To see it, hover the open price of a position, open or closed, on an account or portfolio page: a tooltip shows the slippage (in pips for forex, as a price gap for gold, indices or stocks), its equivalent in money and the requested price. Positive slippage is in your favour, negative slippage cost you.
The measure is exact for pending orders (limit, stop) that became positions. For market orders, the reference price is the market price at the moment of execution. On MT4, the slippage of pending orders is already computed by the site, no update needed.
MT4 and MT5 — Windows in another language
Data is now always sent in UTF-8. On a Windows system set to another language (a Chinese VPS, for example), a broker name, account name or comment with non-Latin characters could block every upload. Special characters in comments are handled better too.
Update
If you installed the EA from the MQL5 Market, the update is automatic.
Otherwise, download the .ex4 / .ex5 files again
from your dashboard
and replace them in the MQL4/Experts or MQL5/Experts
folder of your terminal.
The Portfolio Lab moves to version 1.1, with three new features to read the chart in more detail. Click the version number, at the top right of the tool, to see the list of changes at any time.
One curve per strategy
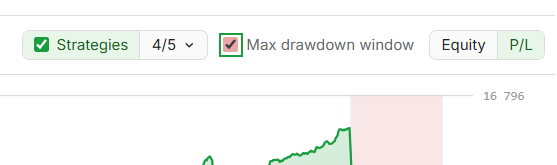
The "Strategies" box above the chart shows the curve of each selected strategy on top of the overall curve. The arrow next to it opens the list of curves: one box per strategy to show them one by one, and their colour works as the legend. The tooltip gives each one's gain. Only the chart changes: to remove a strategy from the total, untick it in the bottom panel.
Period filter
The "Custom period" button in the top bar opens two calendars to pick the start and the end. The chart, the correlation matrix, the calendar and the bottom tables then only cover that period. "Common period" sets the dates to the period when all ticked strategies trade at the same time: handy to compare two EAs or two backtests.
Equity or P/L
A two-way button above the chart switches between the equity curve (starting balance + gains) and the cumulative profit and loss alone.
Open the Portfolio Lab — your feedback is always welcome.
The Portfolio Lab is a new free tool in the FX Live suite to analyse your backtests and your live trading results. It keeps what we like about a tool such as Quant Manager, and goes further.
The essentials at a glance
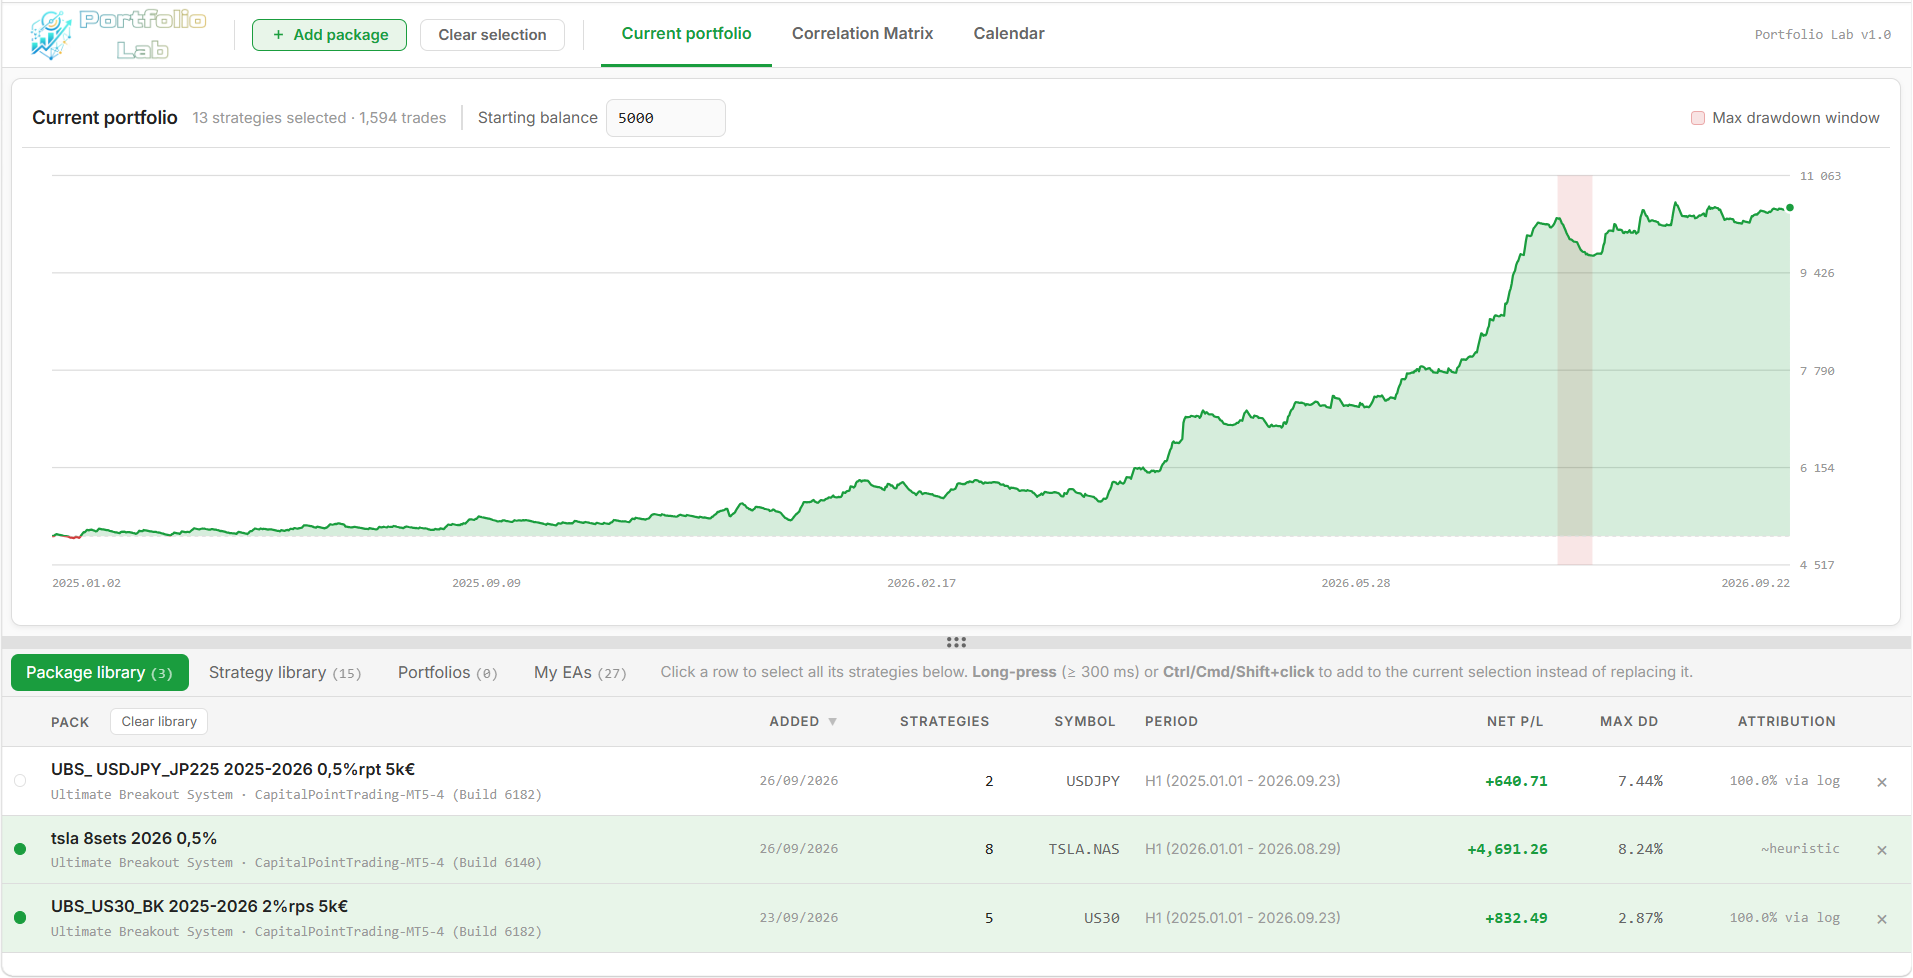
- The equity curve and the drawdown periods.
- The key metrics: Profit Factor, Recovery Factor, max drawdown, win rate, Sharpe…
- Portfolios that combine several strategies, to see which ones contribute the most (or the best) to the P&L.
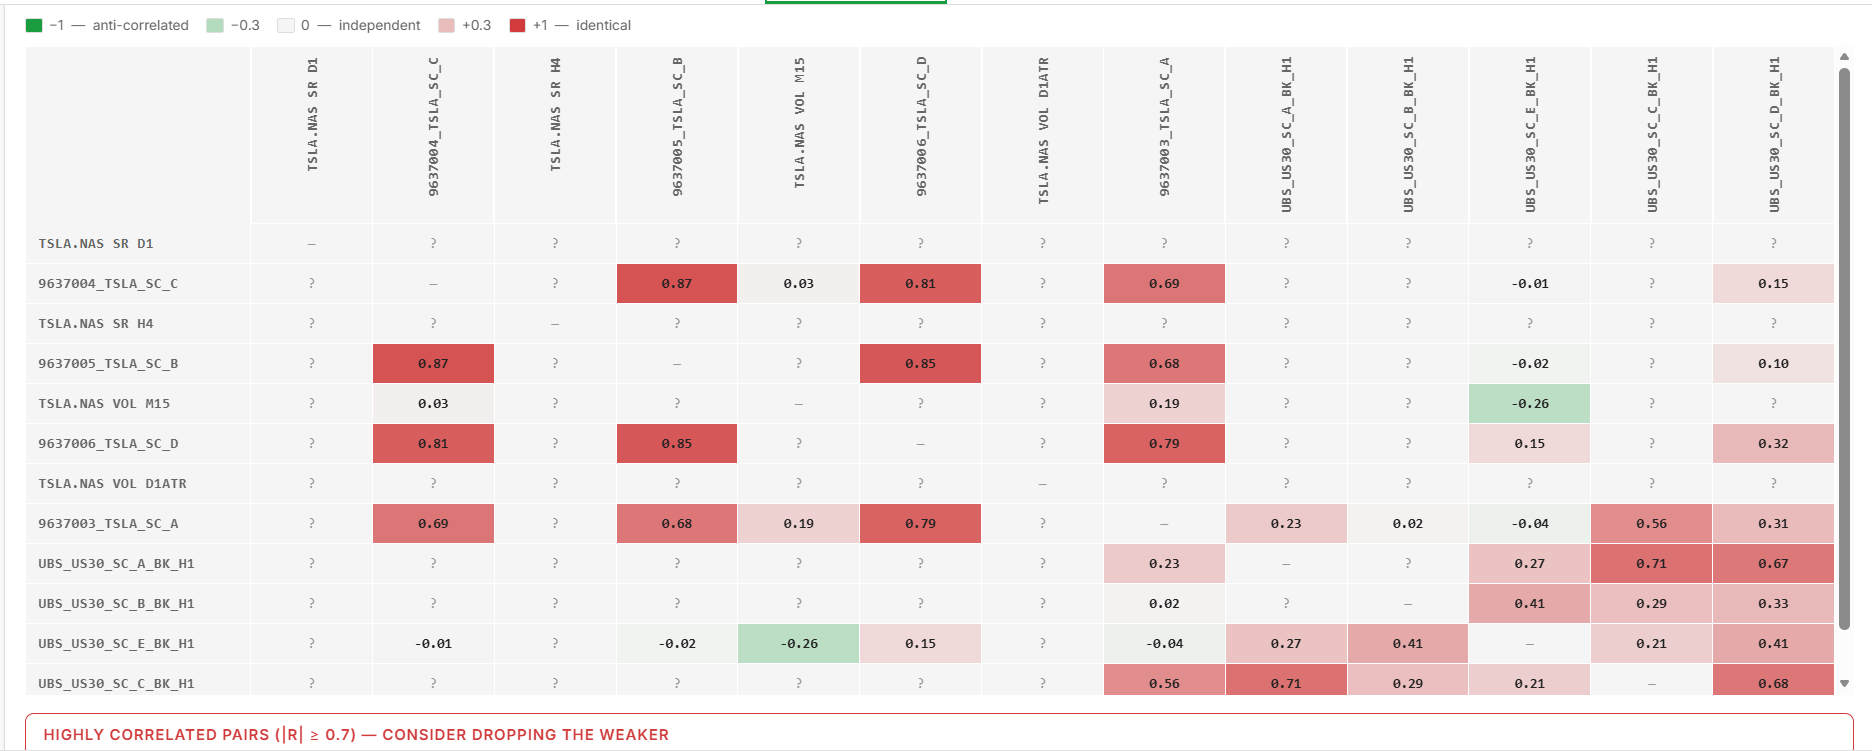
- A correlation matrix to spot strategies that lose at the same time.
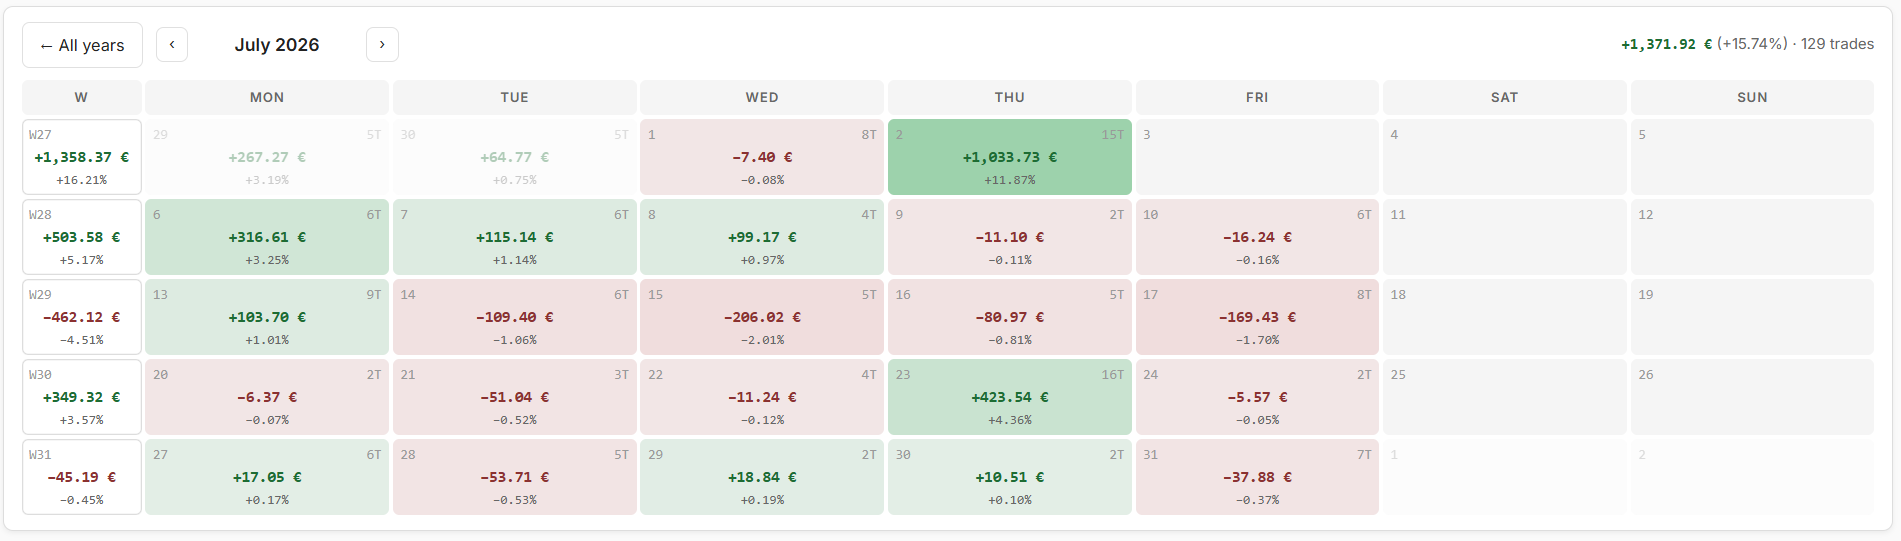
- A calendar of results by year, month, week and day.
For UBS users
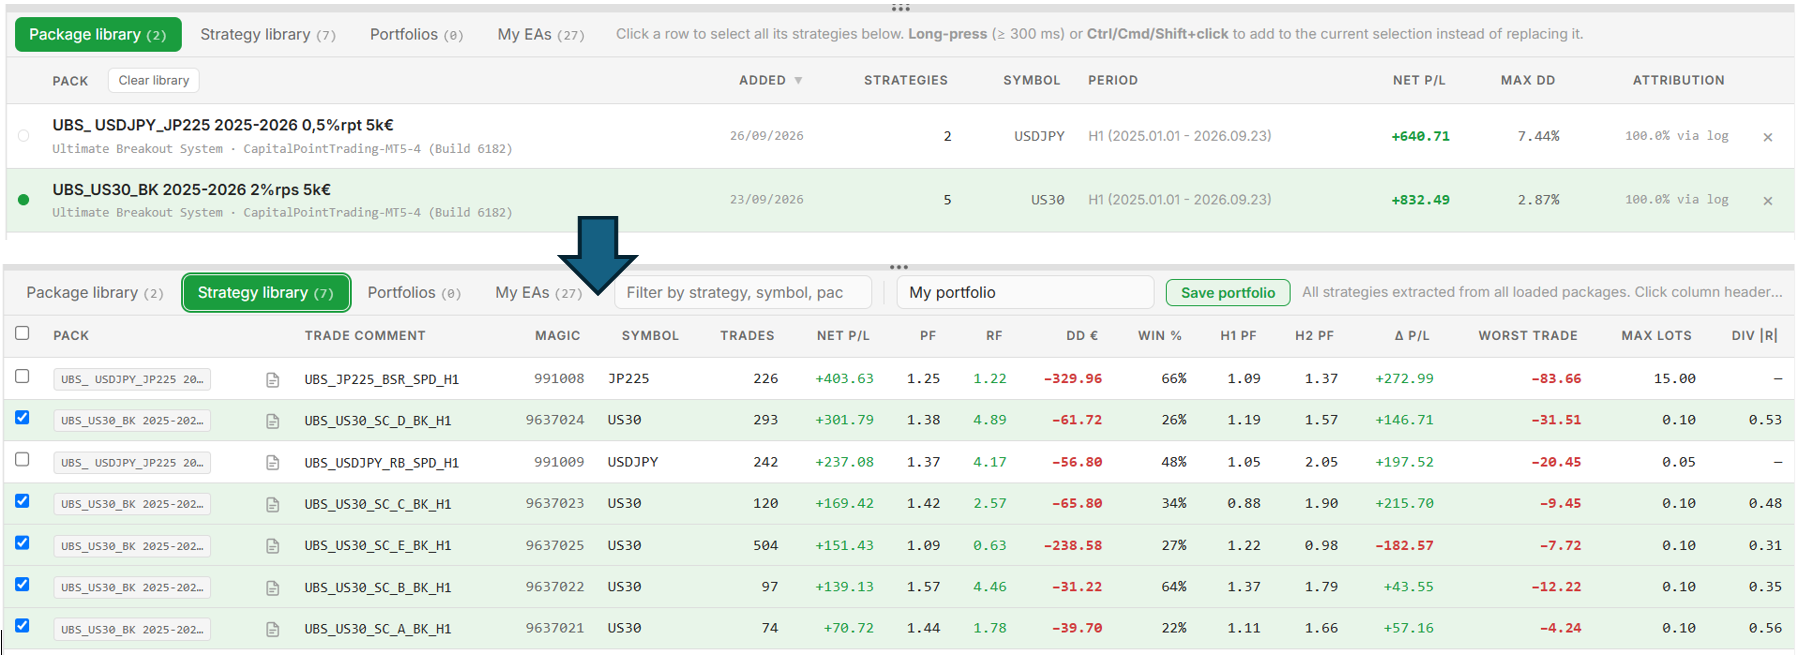
Import a report from the Autoloader: the tool identifies each setfile used
and offers a strategy-by-strategy analysis. It becomes much easier to spot
the best ones and build the best portfolio. A single .html
file is enough; add the .set files and the MT5 logs, and trade
attribution becomes exact.
Your live history
FX Live users who have already imported the data of their MT4/MT5 accounts find their EAs in the My EAs tab, expandable strategy by strategy, to do the same work on their real trades.
No account is needed to analyse your backtests, and everything is processed in your browser: your files are not sent anywhere.
More is coming (trade list, comparing live history with backtests), but the tool is already complete enough for in-depth analysis. Try the Portfolio Lab — all feedback is welcome.
To avoid any confusion, the “Strategies” page becomes “EA”. It now makes more sense to talk about our strategies in terms of the magic numbers they are linked to (via the Magic Database), and then to group them into the sets they belong to — especially when one of our EAs (Expert Advisors) uses several magic numbers to run its strategies.
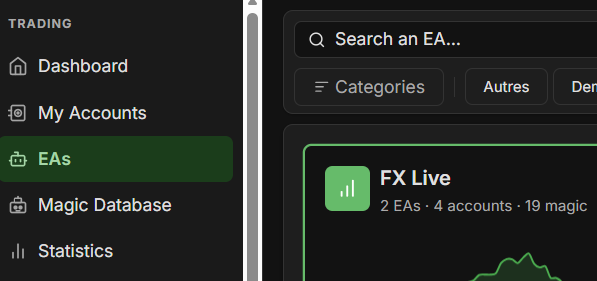
It also paves the way for the new tool of the FX Live suite: the Portfolio Lab. It lets you load and analyse your backtest reports in depth, and also see in detail how the strategies already traded on your MetaTrader accounts behave.
More to come. In the meantime, you can try the tool and find out more here.
Version 7.1 of the MetaTrader Setfile Editor brings several improvements to the tool — and some that you will definitely love.

1. One-click reformat to the UBS 7.6 format
A button reformats your file to the UBS 7.6 format: it applies all the latest parameters and strategies (as if you had loaded a file from an older version into UBS 7.6 and re-saved it).

2. Toggle switches on every boolean
All boolean options (true/false) now have a toggle switch — clearer to read, faster to flip.

3. Rename the file from its comment
A button in the "comment" field lets you rename the file after its comment. Handy for quickly reorganising your folders for the autoloader.

4. Drop-down menus for fields with limited options
Fields with a limited set of options (Risk, Strategy, Timeframe, etc.) now display the selected option and offer a drop-down menu. Drop-downs are also available in batch.

5. "Apply-to-all" replaces the Batch Edit section
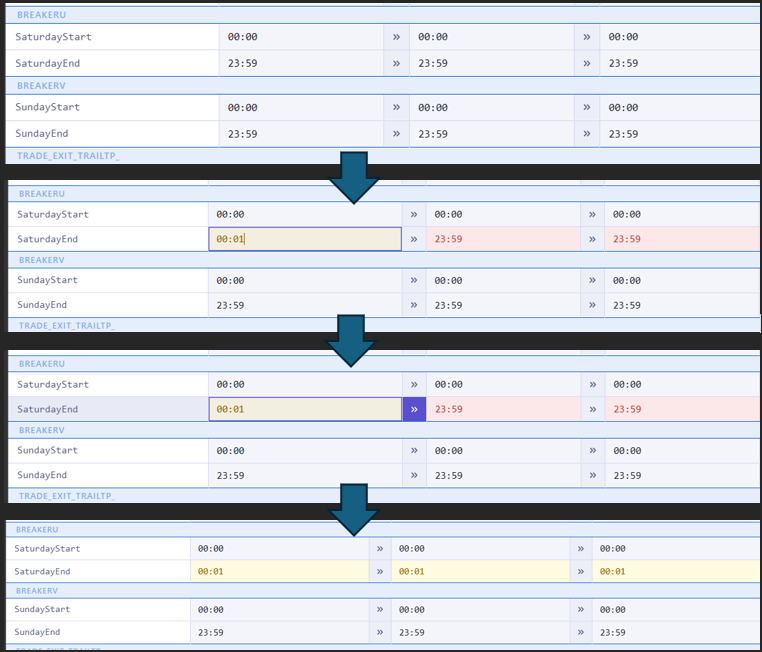
The "Batch Edit" section has been removed and replaced by a much easier button that copies the value of a parameter to every other setfile loaded on the page. Much faster to edit many setfiles at once — search for the parameter, edit the first box, apply the value to the others.
Ultimate Breakout System is the best creation of Wim Schrynemakers, developer of Gold Reaper — the #1 EA on MQL5.
Version 7.64 of the EA is now available on the MQL5 Market (both MT4 and MT5). It fixes two issues on closed positions on the MT5 side and adds a safeguard on data upload when Algo Trading is disabled.
MT5 — Stop Loss and Take Profit recorded on closed positions
Until now the SL and TP columns of the closed-positions history stayed empty on MT5 — the EA was sending zero. Fixed: the values are now read from the closing deal and displayed in the table. On top of that, when a position closed exactly at its SL or TP, the corresponding value is shown in color (red for a hit SL, green for a hit TP) — one glance is enough to spot the trades that exited automatically.

MT5 — Total commissions fixed
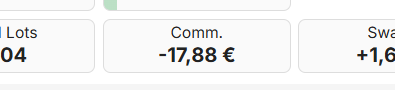
On brokers that charge commission in two steps (once on entry, once on exit), only the "exit" half was being reported to the site. The EA now aggregates both halves and distributes them proportionally on partial closes. The amounts shown in the Commission column match what MetaTrader displays.
"Algo Trading" safeguard
When automated trading is disabled — either via the Algo Trading toolbar button, the Allow Algo Trading checkbox in the EA's per-chart settings, or because the terminal is not connected to the broker — the EA suspends all its uploads (both the position data and the heartbeat). Sends resume automatically the moment every light turns green again. A red message in the HUD spells out the exact reason. Goal: don't mask an EA that's actually stalled behind a stream of data that would otherwise keep flowing, and let the site trigger its disconnection alert when the EA is intentionally — or accidentally — idle.

Updating
If you installed the EA from the MQL5 Market, the update is automatic.
Otherwise, re-download the .ex4 / .ex5 files
from your dashboard and replace them in the MQL4/Experts
or MQL5/Experts folder of your terminal.
The EA disconnection alert system is now live for all users, alongside the official release of EA v7.63 on the MQL5 Market.
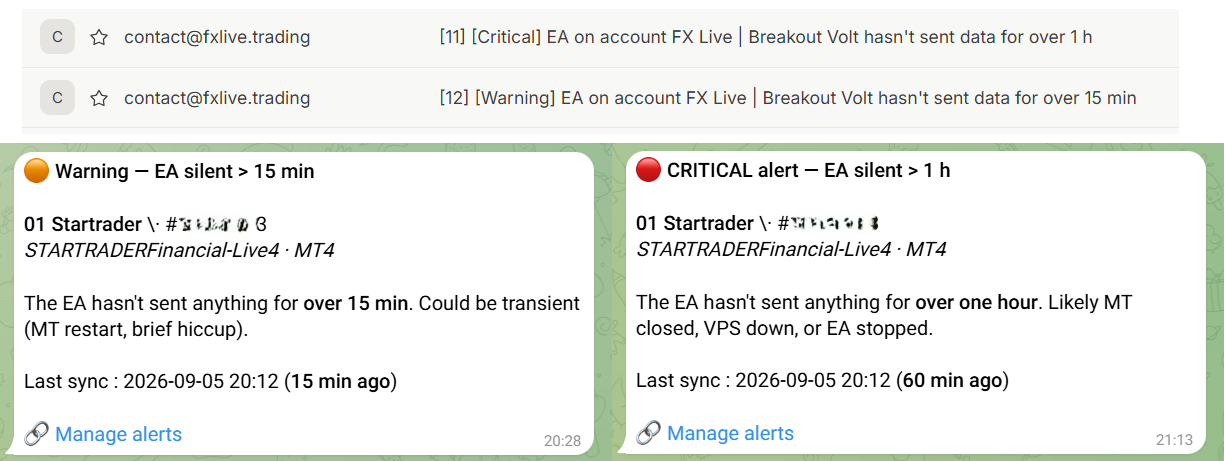
Whenever one of your EAs stops sending data — VPS down, MetaTrader crashed, platform closed without you noticing — you get an alert so you know as early as possible. Two thresholds, to stay reliable without becoming noisy:
- First warning after 15 minutes of silence.
- Second warning after 60 minutes — by this point, something clearly needs your attention.
Alerts arrive via email and/or Telegram, your choice.
How to enable it in 3 minutes
- Update your EA to v7.63 — either via the MQL5 Market
(recommended, future updates arrive automatically) or by downloading
the
.ex4/.ex5files from your dashboard. The system only works from this version onward. - On the « My Accounts » page, click the 🔔 bell next to each account you want to monitor. Each account can be toggled independently.
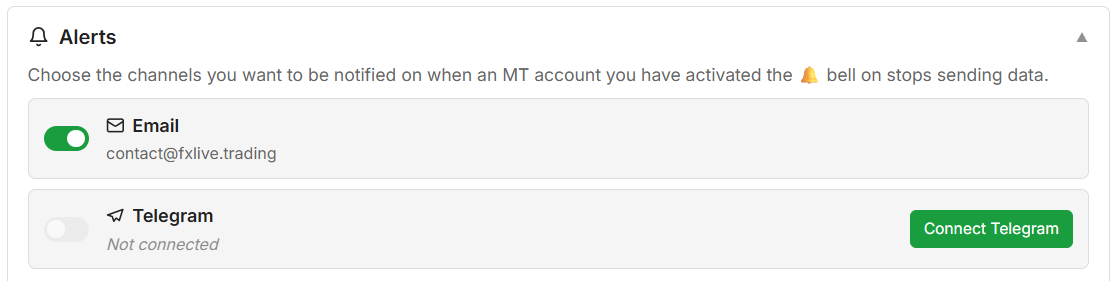
- On your dashboard, open the
« Alerts » box and pick your channels — email,
Telegram, or both. For Telegram, a one-click deep link connects
your account through our bot
@FXLiveAlertsBot; no password required.
Need to be warned faster?
1-minute sync (instead of 5 min) and 1-minute alert reactivity (instead of 15 / 60 min) are available on request. Drop us a line at contact@fxlive.trading, on Telegram @Jaghonn, or on our Discord — we'll work out the setup that fits your use.
On MetaTrader 4 only, the EA can only send the closed positions currently visible in the "Account History" tab at the bottom of the terminal. If you have filtered that tab to "Current month" or any short period, only those trades will be sent — your older trades won't be uploaded to the site until you widen the filter.
What to do, once for all: right-click in the "Account History" tab → "All history". From that moment the EA has access to everything, and you can re-filter the local view later without any loss: the maximum ever seen stays known and the site keeps receiving new trades normally.
EA v7.63 automatically detects when the full history becomes available and triggers a full re-upload at that moment — no need to wait for the next scheduled resync. A red warning also appears in the HUD if your filter is narrower than what has already been sent, so the case doesn't slip through.
MT5 is not affected: its API lets the EA code select the full history regardless of what the terminal displays.
On the pages showing the open positions of an account or the portfolio summary, you can now see the estimated gain or loss — in the account currency and as a percentage of the balance — that the Take Profit or Stop Loss would trigger if hit.
Just hover over the Take Profit or Stop Loss value to see the tooltip.