

Edit your UBS set files in the
 Setfile Editor
Ultimate Breakout System
User Manual v7.7

Introduction
CHECK OUT OUR YOUTUBE VIDEOS: https://www.youtube.com/@forexeasolutions
JOIN THE DISCORD: https://discord.com/invite/RvkRTxy36K
Welcome to the Ultimate Breakout System!
The title for this EA is not just chosen as a sales pitch. I truly believe this system is one of the best, if not THE best breakout system on the market. It has been in development for more than 8 years in total, and I personally used it to create over more than 60 working strategies that I use daily in my many private trading accounts.
The system is fully customizable with a huge variety of parameters to optimize, both for entry and exit of trades. It can basically be used for creating unlimited strategies for any market, and for any timeframe.
Ofcourse, a good system, without a proper manual on how to use it, is almost worthless, so I will include a full description, on how to create your own strategies, that have the highest probability of making profits in real live trading accounts.
So let’s get to it!
What is a breakout strategy?
There are 3 types of breakout strategies
1) Breakout of support and resistance
2) Volatility Breakout
3) Range Breakout
Breakout of support and resistance
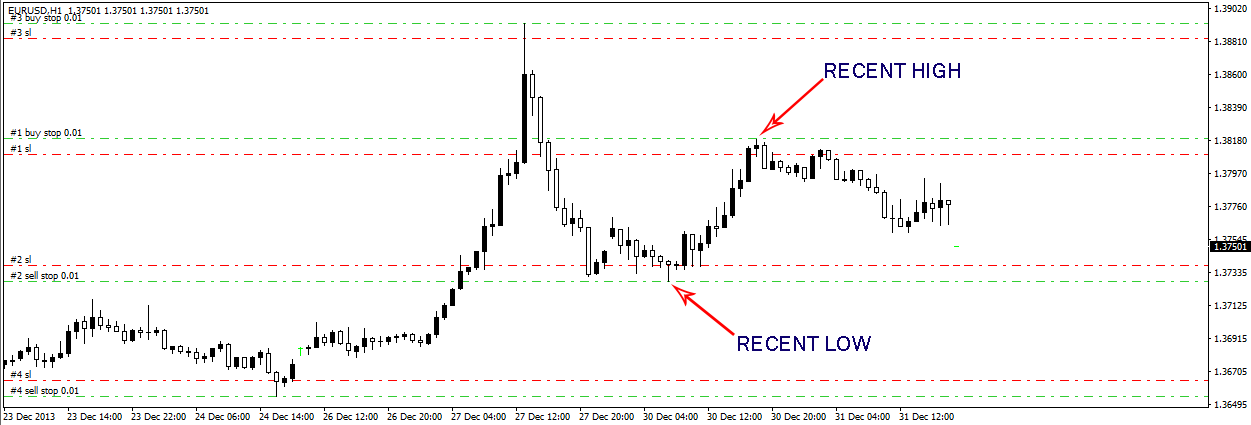
The strategy itself rather simple from a visual perspective. The EA will detect important support and resistance levels (recent highs and lows that stick out), and will put pending stop orders at those levels, which will be triggered when price breaks through those levels.
Each trade can be set up with a SL, TP, various TrailingSL options, and also a TrailingTP option
This breakout strategy had been used for decades by professional technical traders already. Longterm this is one of the most consistent strategies in trading in my opinion.
For swing systems, this can be used on higher timeframes, like H4, Daily or even Weekly charts
For scalping systems, this can be used for lower timeframes, from H1 to M1.
Why is this strategy such an effective one? Because it follows market structure during trends. When markets trend, they are either making higher highs, or lower lows. For this, they simply must break through the support and resistance levels. And since so many traders keep an eye on these levels, either to enter the trade on the breakout, or their stoplosses get triggered, it becomes a self fullfilling prophecy.
Volatility Breakout
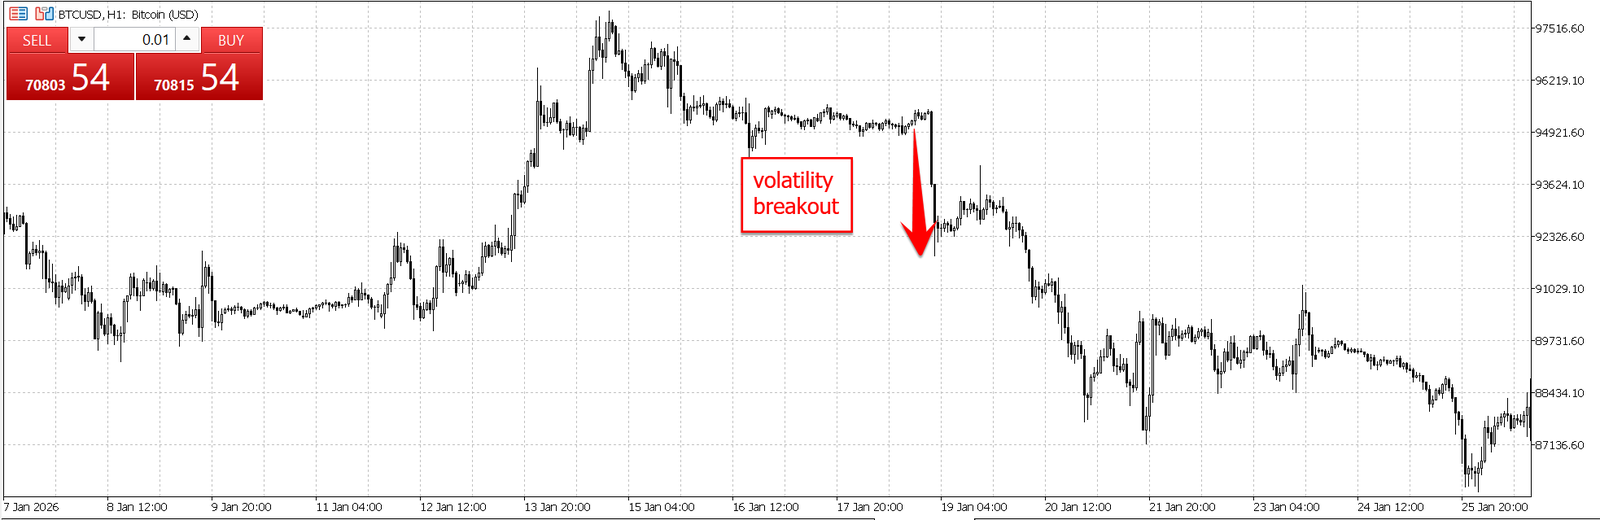
A volatility breakout is a breakout that shows a sudden strong move in a certain direction (up or down) after a rather quiet period. The idea behind this strategy is, that if price starts moving strongly in one direction, the probability of it continuing in that direction is higher than it reversing. A commonly used approach for this, is comparing the recent candle size(s) with the ATR. This basically tells you the recent move compared to the average movement of price for the symbol.
Range Breakout
A range breakout looks for the opposite condition to a volatility breakout. Instead of a sudden large move, it looks for a period in which price went almost nowhere. When a market coils into a narrow range, the eventual move out of it is often decisive, because orders build up on both sides.
This model checks once per day, at a time you choose, and measures the range that formed just before that moment. A common use is a session open: measure the hours before the open, then trade the break of that range. If the market was already moving strongly during the measured window, the range is rejected and the day is skipped.
Because the maximum range height is expressed as a multiple of ATR rather than in pips, the same settings behave sensibly in quiet and busy markets, and transfer between instruments without retuning.
How to install the EA
If you purchased it directly on the MT5 Market, the EA will be installed automatically on your MT4/MT5 platform. You only need to set it up on the charts.
If you purchased on MQL5.com then you need to install it on the MT5 platform first:
- First go to MT5 → Tools → Options → Community → Fill in your
MQL5 credentials
- Then go to MT5 → Market → Purchased → Ultimate Breakout System
→ Install
If you received the ex5 file directly from me → please go to your MT5 → FILE →
OPEN DATA FOLDER → MQL5 → EXPERTS → advisors → put the EA file here in this folder. Then restart your MT5. It is now available in your experts window.
Getting the MT5 platform ready for trading: Go to MT5 → Tools → Options → Expert Advisors and set it up like this:
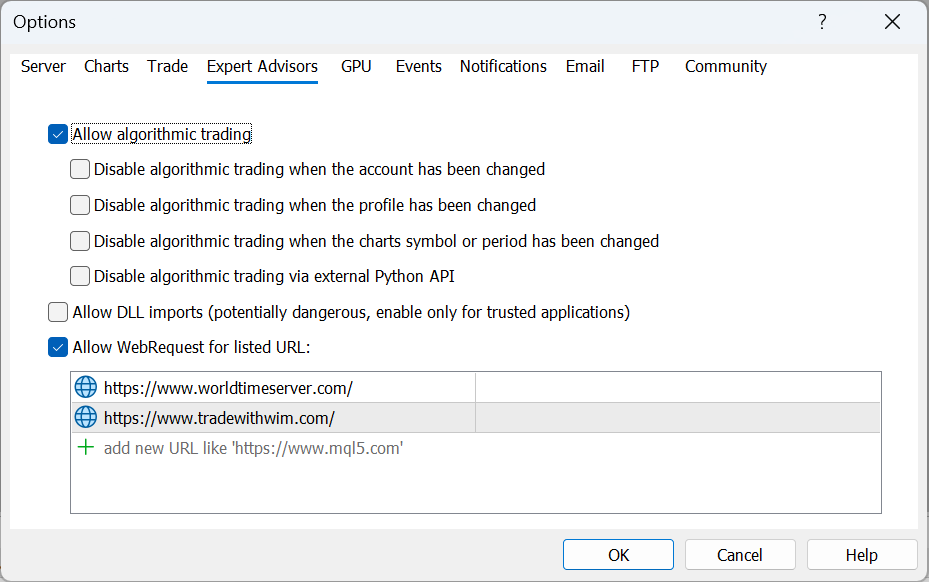
The URL https://www.worldtimeserver.com/ must be added as indicated, in order for the AutoGMT to work. This is necessary when using the news filters
If you received the EA directly from me, you must also add the URL https://www.tradewithwim.com/ for the licensing system to work.
Broker choice: For optimizations and backtesting, I mostly use Metaquotes demo account. They have very good historical data for Forex and Gold. For Indices, I used ICMarkets, since the data from Metaquotes didn’t seem good enough. Keep in mind that many brokers don’t have good historical data, so it is usually recommended to use Metaquotes data for most optimizations.
First use of the EA
The default parameter settings of the EA, are the result of an optimization that I ran for XAUUSD Daily chart, so you can use it to run some backtests and get a feel of how the EA works. (a full description of the parameters is available in the end of this manual.)
This default set can also be used for live trading, as it is a solid strategy already. I have used a +10 year out of sample period in the creation process of this set, so I’m confident it will uphold during live trading as well.
I recommend running a visual backtest of using default settings, and see how the EA locates the support and resistance levels, and sets its pending orders at those levels.
You can already start playing around with the entry and exit parameters, to see what effect they have on the trades. This is the best way to learn to understand how the algorithm works.
I have also included ALL the parameter sets that I ever developed using this EA. Including those that I used for my breakout system on MQL5 (Daytrade Pro, Goldtrade Pro, Gold Reaper, Goldbot One and Indicement). You also use these already for live accounts to make your own unique portfolio setups.
Most of my set files that I have included are for longterm trading, which means that if you run a backtest, it makes no sense to do “very short-term” backtest. I recommend running at least from 2020-2025, but even from 2000-2025 they should be stable.
NOTE: From UBS Version 5.0, all sets are set to fixed lotsize 0.01lots for forex symbols, and to 0.1lots for Gold, Bitcoin and Indices. Basically all markets that go up over time, and are using “variable Values” (see further for more info on this). This is done to easily run the backtests needed to calculate the risk per strategy.
To load a strategy (set file), you simply click on “load” in the inputs-window (first right-click anywhere in the inputs window for backtesting), and then select the set file.
Using the AutoLoad function (OneChartSetup)
Since Version 5.0, there now is the possibility to run multiple sets from 1 chart, whether live, or during backtests. This helps making portfolio setups much easier, preventing the need of having to run the EA on multiple charts.
In preparation for this, I already adapted all the existing set files for this new option. Basically, what I did was make sure that all set files have different magicnumber, (and a different trade comment). This is needed to make sure that different strategies don’t start managing each other’s trades. Also, I made sure that no parameters were missing in the set files, as that could make the set file not load into the OneChartSetup.
Also, I introduced a new way of calculating lotsize, based on Max Risk Per Strategy. For this to work, I added the correct historical max drawdown values for each strategy (set file). So now, we can simply run multiple strategies from 1 chart, select a Max Risk Per strategy and the EA will nicely balance all strategies. For example, you could run 20 strategies, all with 2% risk per strategy, and in one backtest, you would see what the total max drawdown would be. This make creating portfolios and setting them up much easier compared to the past versions!
IMPORTANT: To use the Autoload Function, we first need to prepare the set files. I did all of the preparation already (adding a Max historical Drawdown value for each strategy/changing magicnumbers etc..), but if you want to make individual risk settings per strategy, or want to use your own strategies, you still need to do/check all these steps:
1) Set a unique Magicnumber. Each set should have a different magicnumber. In theory, if magicnumber is the same but it’s a different symbol, it won’t cause any issues, but best to simply apply this practice to every set.
2) Set the correct symbol in the ForceSymbol parameter. Here you must set the EXACT name of the symbol of market you will be trading with that set files. So if you broker uses XAUUSD.ecn instead of XAUUSD, you must adjust it in the set files!
Especially for Indices, these symbol names can be very different for each broker
3) Determine the correct “max historical drawdown” value (per 0.01lots, in \$) and fill it in into that parameter
4) Make sure that no “timing” parameter (like entry timing, or timeframe to use) is left at “current”. Set it to the correct timeframe (H1, M5, or whatever)
5) Set your lotsize settings for that set file (if you want individual settings per strategy)
6) Make sure there are no parameters are missing in the set files (easiest way to do this, is by simply loading your old setfile into version 5.0, and saving it again)
In our Discord community, there is a great tool available to easily adjust set files together. This tool is also included in the UBS zip file containing all the set files (setfile-editor.html). Make sure you are using a set file saved in Version 5.0 in order to have all parameters visible in this editor!
When you have all the strategies ready, and correctly formatted, you need to place them in the correct folder so that the EA can find them. This folder is located in your MT5’s data folder. The easiest way to go there, is by going to your MT5 → File → open data folder. From there, you go one folder up, to the “terminal” folder.
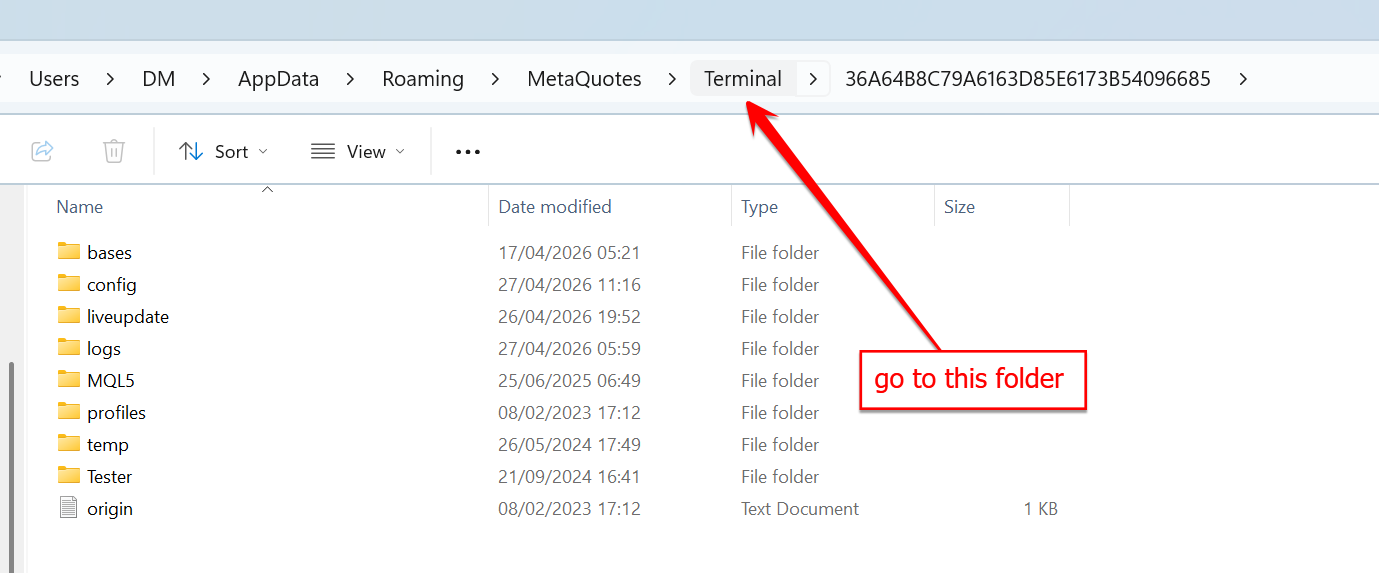
Once there, go to “common → Files”. In this folder, you create a folder called “Sets”
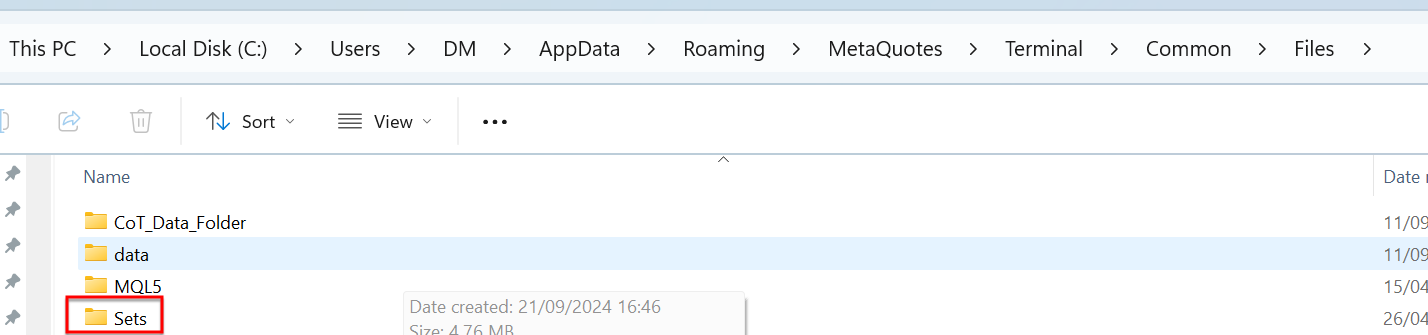
And in this folder “Sets”, you put all the set files that you want to run together:
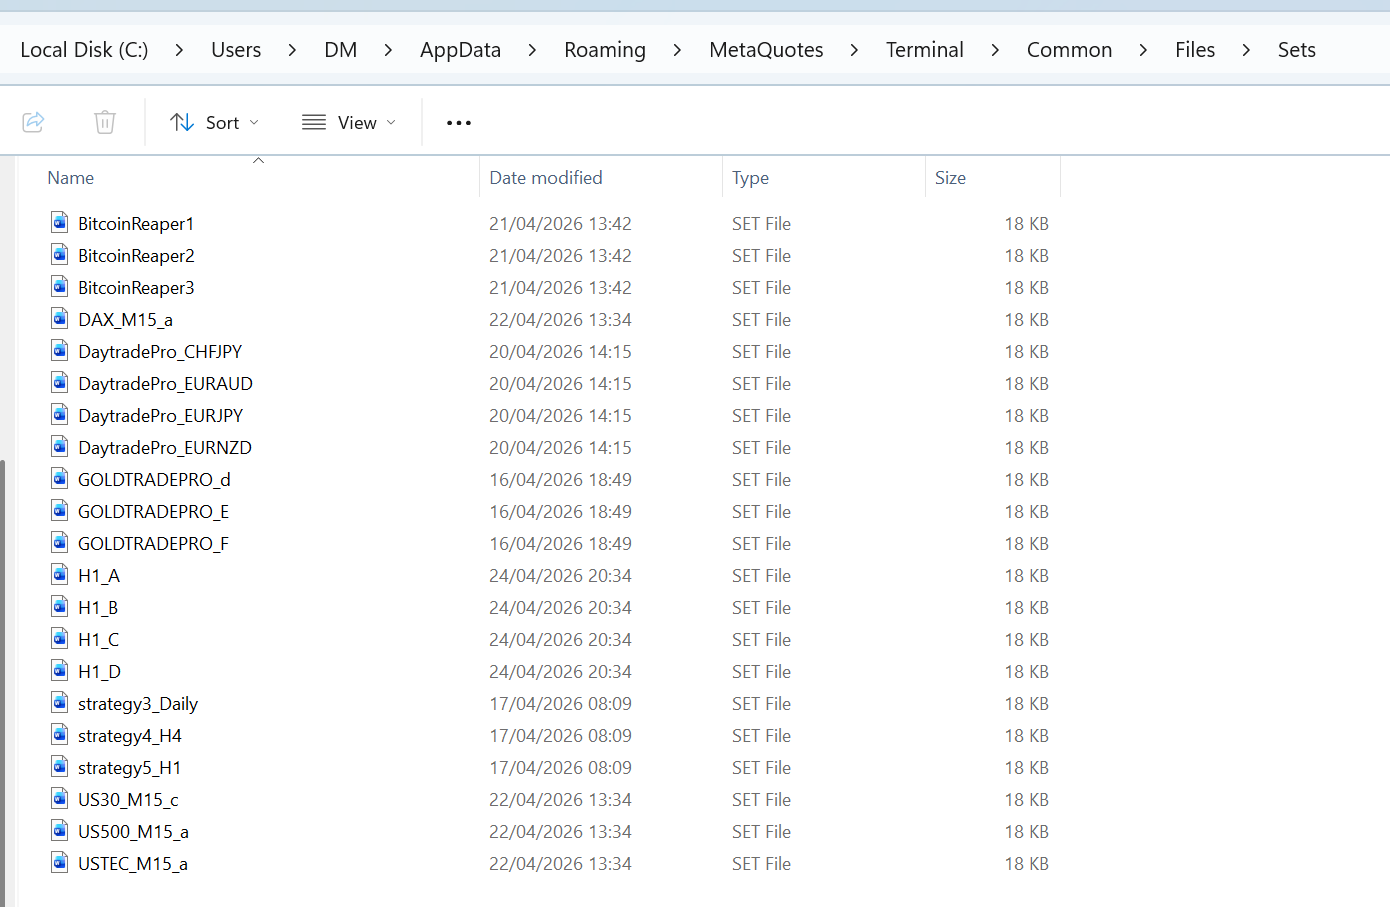
Now all set files are ready to go!
Now, to enable the OneChartSetup, go to the EA’s parameters, and enable the “AutoLoad” function.

There are some other parameters you can set, for changing the folder where your set files are in, and override parameters, when you want to use the same lotsize settings, news filter or trade time settings for all sets in one go.
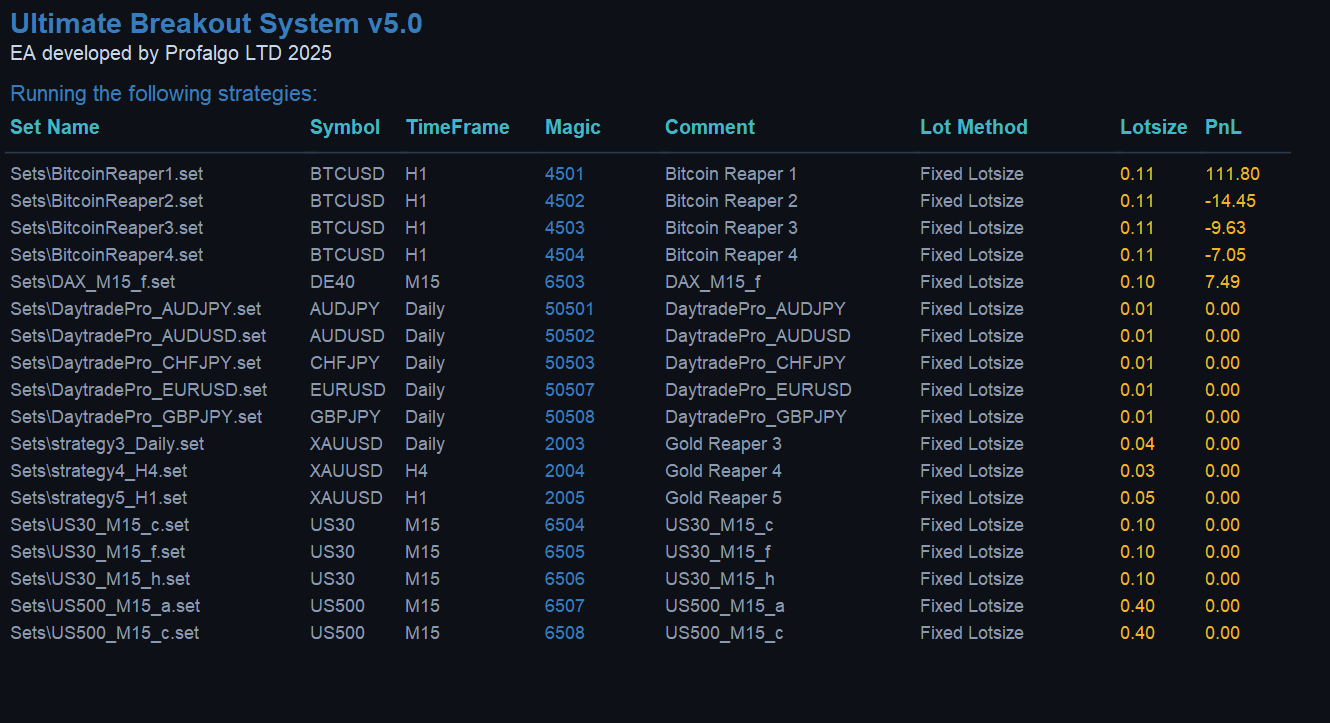
When you launch the EA, you will see a nice infopanel, showing an overview of all strategies that will be run, including important data for each one:
The recommended way to run portfolios, is to simple set a fixed Max Risk Per Strategy for each strategy. You can easily do this by overriding the AutoLoad Lotsize settings, and then setting the lotsize settings as below:
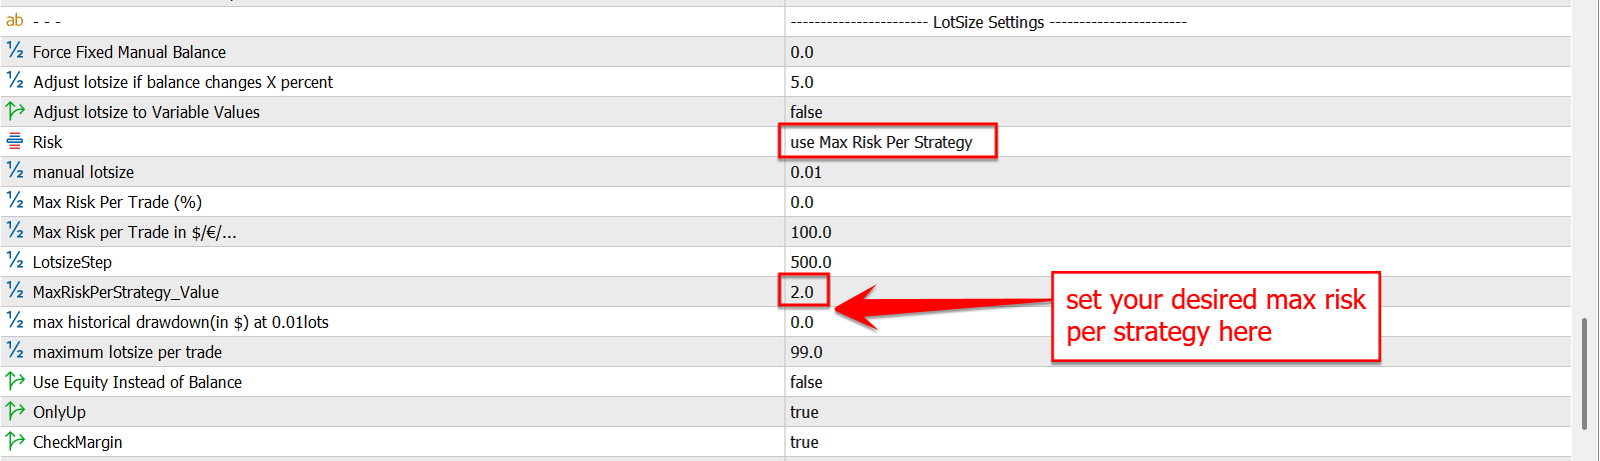
Some of the lotsize settings can NOT be overridden:
- Adjust Lotsize To Variable Values → this will only override when you
set it to “false”. If you set it to true, it will take over the value of the set file
- Max Historical Drawdown (in \$) at 0.01lots
The reason why they can’t be overridden, is because they are unique for each set, and it makes no sense in making them global.
With the new setup that we just did, the infopanel will look like this:
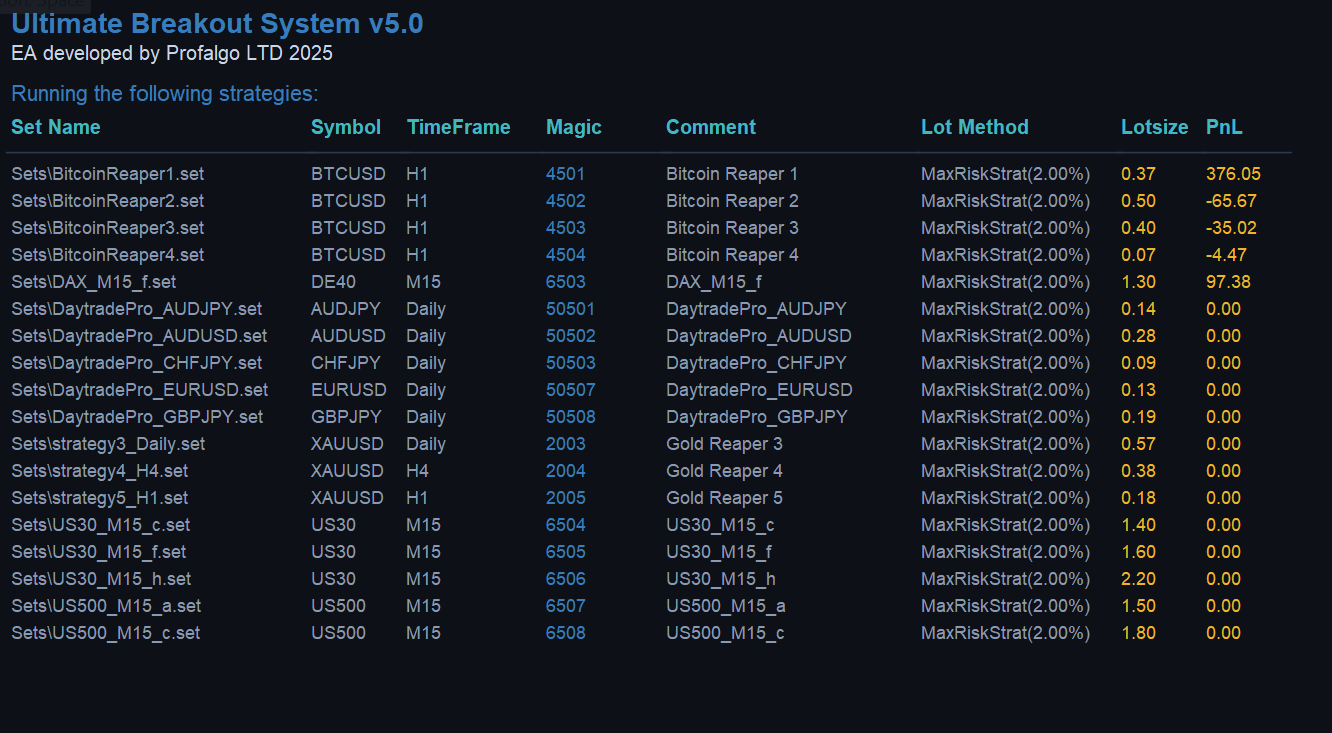
Where we have a nice overview of each strategy.
I have created a nice 30-strategy portfolio already which you can check out here: https://www.mql5.com/en/market/product/133653/comments/page5% 23comment_59937684
Your First Optimization
The main feature of this EA, is ofcourse the ability to create your own strategies, so let’s get to it!
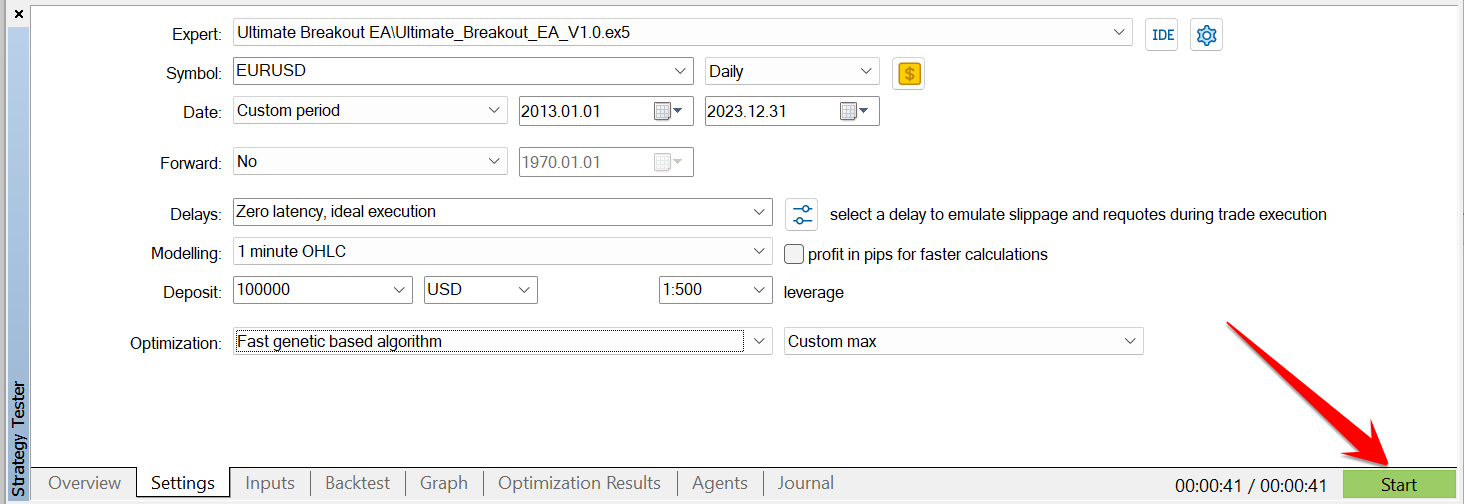
First things first: Setting up the strategy tester
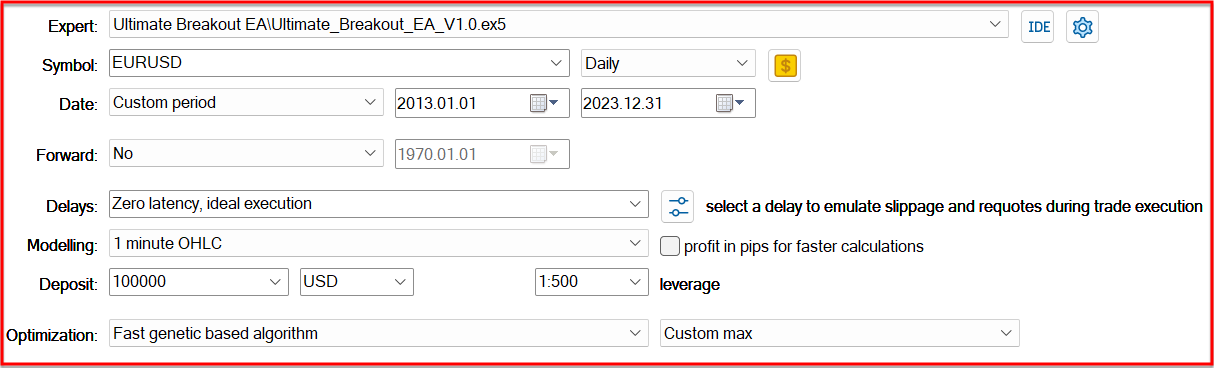
As the picture shows, this is how I like to run most of my initial optimizations.
Date: custom period from 2013 till 2023.
Why? This is a 10 year period, which is sufficient to get some valid strategies, which we can then run on the out-of-sample data (from 2000 → 2012 and from 2024-2025), to confirm their robustness.
To me, this is one of the most important things to do, for increasing the probability of having a strategy that will work on future markets. We need to know how the strategy runs on unknown markets.
You can play around with the custom periods, to create different strategies. For example you could run an optimization from 2010 → 2020, and then use 2020-2025 for out of sample period. Different periods will create different strategies.
Forward testing: I don’t use this option, because it will force the optimization process to push towards strategies that perform well in-sample and out-of-sample, and will basically result in the same as if you would optimize the full period of in-sample and out-of-sample. I prefer doing a in-sample optimization first, and then using those results to manually test out-of-sample.
Delays: I don’t use it for optimization, and rarely for stress testing either. The EA uses pending orders, and delaying the pending order doesn’t make any difference to the execution of that pending order.
Modeling: I mostly use 1 minute OHLC quality of modelling when trying to find swing strategies. When trying to make scalping strategies, I would use “every tick using real ticks”, but on a shorter period (ex. 2020-2023). For swing systems, it’s important that you set your parameters for minimum stoploss, takeprofit, trailingSL etc values not too small in pip values. That way, the backtest using 1Minute OHLC will look in line with the “every tick using real ticks” backtest. This is no guarantee yet, so I always run a “check” on a shorter period of time. For example, if I find good strategy parameters on 1Minute OHLC, I would then first run a 2024-2025 backtest on both 1Minute OHLC and Every tick using real ticks, and compare both. They should look more or less the same. That doesn’t mean that the exact value for profits will be the same, but the shapeof the growth curve should, and they should ofcourse both be profitable. This is just to confirm that the 1Minute OHLC backtest will be good enough for further testing on that strategy. And only after that validation, I will start doing my out-of-sample testing on the earlier periods (like 2000-2012), using only 1Minute OHLC. Because we now validated that the strategy is reliable to be tested on 1Minute OHLC modelling.
Deposit: I usually set the deposit to 100K. Simply because I don’t want any margin problems etc to affect the trades in the backtest. And I want to compare the profit and drawdown in \$ for each strategy at a fixed lotsize of 0.01lots. I always run my optimizations at 0.01lots (or minimum but anyways “fixed” lotsize). This is because it will make comparing strategies much easier. Your growth curve won’t become some exponential looking curve that doesn’t show the longterm stability. If we know profits and drawdown at 0.01lots, we can easily determine the risk, minimum account balance, and we can easily combine strategies in Quant Analyser for making uncorrelated portfolio’s. This would all be much harder if you use automated lotsize that increases when the account grows. So the deposit size doesn’t really matter, but I make it big enough that it won’t affect the trades in any way.
Optimization: I set this to “fast generic based algorithm”. It will go much faster then trying to do a slow complete (every possible combination) optimization. Also, if you are going to use the MQL5 Cloud for optimization (which I highly recommend to speed up the process), this will cost a lot less, then when using the slow complete optimization. Only after the initial optimization is done, and I want to fine tune some strategies, I will use the slow complete optimization. But usually only when I’m optimizing maximum 2 parameters at the same time (like SL and TP). Because the fast generic one, might have skipped some of the better values for some parameters. Don’t try to over-optimize every parameter. It will lead to a strategy that looks perfect in backtest, but live it will have much bigger drawdowns and less profit than the over-optimized performance in the past. I like more “rough” strategies, when not all is perfect, but at least I know that live should be in line.
Optimization criteria: this is the setting next to the optimization, which is set to “Balance Max” by default. That means that the optimization process will try to go for strategies that have the biggest balance at the end of each test. I sometimes use that one, but usually I use either “recovery factor max”, or “custom max”. Recovery max, will select those strategies that have a good risk/reward. Strategies that recover fast after drawdown. This usually means a nice average profit per trade as well. I like this, because I noticed that using this for optimization, it usually leads to strategies that are not sensitive to spread and slippage, which we prefer ofcourse. Using the “Balance Max” can sometimes lead the optimization process in the direction of strategies that have 1 or 2 huge wins in the backtest, but not a stable growth curve overall. You want your results to be as symmetrical as possible over the multiple years of the test. Not “1 year making almost all the profits”, and the other years very low or in loss. The risk with using “recovery max”, is that it might push forward results that have very few trades. And we need a good sample size of trades to be able to trust the strategy. So the option I’m using the most lately, is the “custom Max” option. This option will use a parameter, which I programmed into the EA myself. It will basically look at 3 things: Number of trades, Recovery Factor and Expected Payoff. These 3 are parameters in the EA (see parameter list in this manual).
So why these 3?
- Number of trades: because we don’t want strategies that have very few
trades in the backtest. Because that would make it much more unpredictable on how the strategies would work in the future.
- Recovery factor for the reasons mentioned above
- Expected Payoff, because the bigger this value, the more it will
become unsensitive to pricefeed in my experience. I have filled in values for these 3 already in my optimization set files, which I think are a good minimum value for each for the strategies. But you can play around with them. (If you enter value “0” that parameter won’t be used to exclude results if they are below the threshold, but the expected payoff value will still be used for calculation of the “custom Max” results)
Setting the parameters in the EA for optimization (Breakout of support and resistance):
The best way to start, is using the optimizations-set files that you will have received from me after purchase. These are the ones that I actually used for creating my breakout systems on MQL5. So you’ll have optimization-set files for different markets already: Gold, Forex and Indices.
These set files already have good ranges set up for the parameters (for example a stoploss between 30 and 300 pips range). This is important, because when you use bad ranges, it will probably lead to strategies that will look good in backtest, but won’t work on live accounts. For example, having a 2 pip stoploss might work well in backtest, but live, the slippage will kill the strategy. So it’s good to really think about the ranges you will be using for each parameter, depending on the market and timeframe. You can use my optimization sets as guideline, but ofcourse, ideally you make your own optimization set files with your own approach to have the most unique trading strategies.
All the parameters are explained in the end of the manual, but I will give an overview here below of each “parameter-block”, explaining what their main function is, and how to use them, or when not use them during the optimization process.

These parameters have only a visual function and are related to the infopanel that shows some information when running the EA on a chart. No use for the optimization process

The Custom Optimization Settings: These are used, when using the “custom max” as optimization criteria in the strategy tester settings. At value “0”, they won’t be used. By using them, you will order the strategy optimization process, to filter out and rank strategies based on these 3 parameters. You can set the minimum expected payoff, the minimum recovery factor, and the minimum number of trades you want your test results to have. They will also be ranked using all 3, where the recovery factor has the most weight for the ranking (because I believe it is one of the most important criteria for a good strategy).

Spread filter settings: these can be used to filter out trades based on spread. I don’t use this during my optimization process, and I prefer to have no spread filter for initial optimizations. When trying to make scalping strategies, it might have more use.

The “other filters”: these are more interesting for using during real trading, and not optimization process. (description in the parameter list further down in this manual)

The Variable Values settings: one of the features that makes my product stand out I believe. These parameters can be used for markets that have a tendency to continuously reach higher prices over the years. For example: Gold, Indices, Bitcoin etc. Using these will make all entry and exit variables (like stoploss, takeprofit, trailingSL etc…) correlated with the ATR or to the actual price (in relation to the “default price” which can be chosen here). Values “0” means disabled. And “ATR” will override “default price”. So if you want to use the actual price of the market compared to default price for adjusting exit values, you must disable the ATR option (with value “0”). To give you an easy example: Let’s say we are optimizing GOLD, and we set “default price for calculation” to “2000”, and a stoploss value to “1000”. That means that the EA will automatically adjust the stoploss to 2000 if GOLD price is at 4000 in the future.
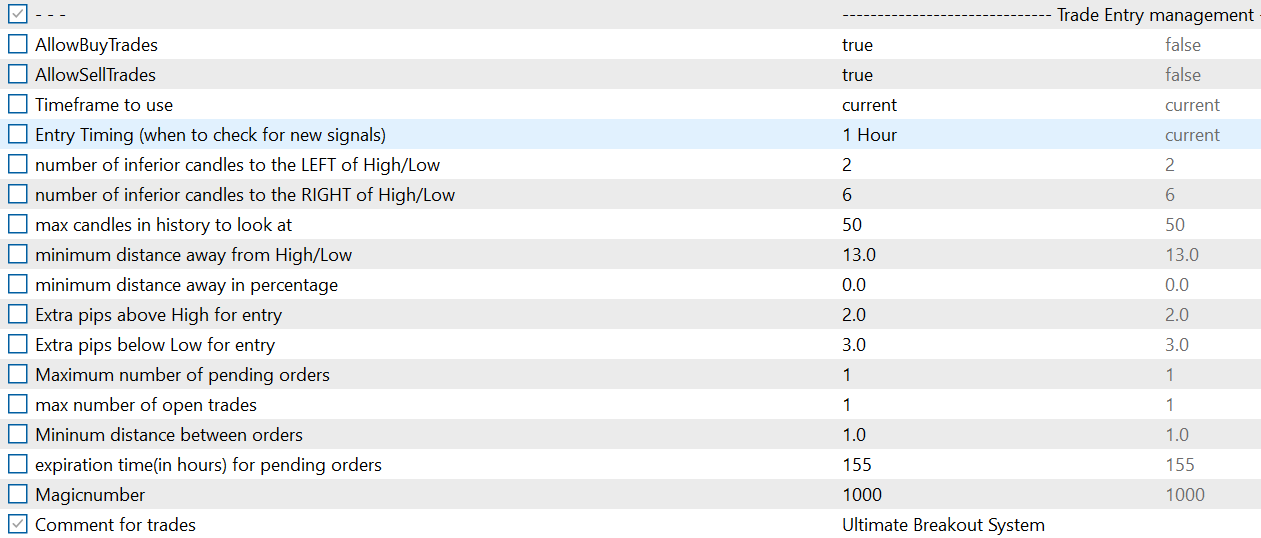
Trade Entry Management: These parameters will be used to determine how the support and resistance levels will be calculated, including which timeframe and which timing should be used for the calculation. But also, how long orders will last before being deleted, how many trades and pending orders should be set, distance between orders. A lot of these parameters are important in the optimization process, to create distinct strategies.
The basic idea of identifying a support and resistance level, is that it should stick out from the candles around it. So, for example, a support level is based on a recent low on the chart. That low must have at least X candles to the left of it, that have higher lows, and at least Y candles to the right of it, that have higher lows as well. Also, the price must be X pips above that support level, before a pending order is place. We also get to chose where exactly the pending order should be place (X pips above of below the level). And we will also determine how many historical candles will be used for finding these levels. It’s good to think about, and look on a chart, to determine which values would be logical. Ofcourse, in my set files, I have already done that, so they can be used straight out of the box. But I believe it’s important to understand how the system works, as it will lead to better strategies or to easier correcting existing strategies.

The Trade Exit Settings: These include the timing for checking when to modify SL, TP and trailingSL options. Also in this block, we can set initial SL and TP of trades. These are ofcourse important to include in optimizations. Keep in mind, that when using the “variable values” settings, these 2 will also be automatically adjust, either to current ATR compared to ATR value set in the “variable values”, or to the relation between current price and “default value” set in the variable values block.
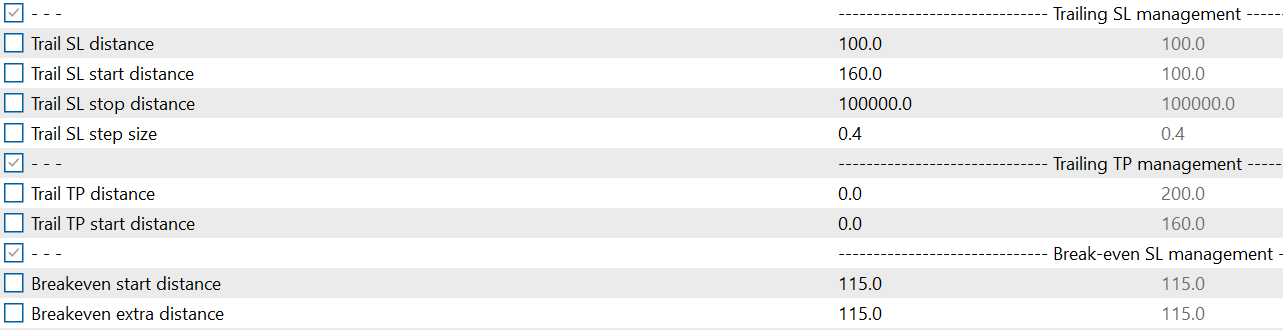
TrailingSL, TrailingTP and Break-Even SL management: These are obvious, and control the modification of SL and TP as price moves in the good or bad direction after the trade was triggered.
Also, these values will be adjusted automatically when using the variable values.
These parameters are most of the time included in my initial optimization process. Though sometimes, I only include TrailingSL for example, and then optimize the other 2 afterwards, when I already have some strategies that seem solid.
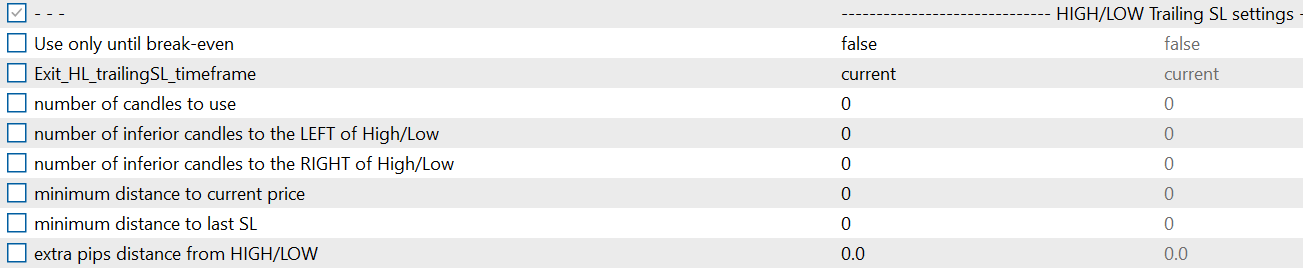
HIGH/LOW Trailing SL settings: This is a different type of trailingSL. The EA will determine recent support and resistance levels, using these parameters, and it will trail the SL based on those levels. So in an uptrend, it might be interesting to trail the SL to a recent support level. Or, in a downtrend to a recent resistance level. I normally do not include these in my initial optimization, but rather check if they can add stability to my first batch of strategies that I make from my initial optimization.

Recovery Trailing SL based on time: this will start a separate trailingSL, X minutes after the trade is entered. I don’t use this one personally

The MagicTrail SL Settings: These are interesting when developing scalping systems. It’s a very aggressive trailing SL, which will basically move the SL X pips closer to the price, with every Y ticks. Regardless if price moves up or down. So, SL will move a bit closer as price moves. I don’t often use this during optimization (surely not for swing system), as it requires “every tick using real ticks” to really see the effect of it. This trailingSL option I normally activate on decent scalping strategies, to see if I can improve it even more with this option.
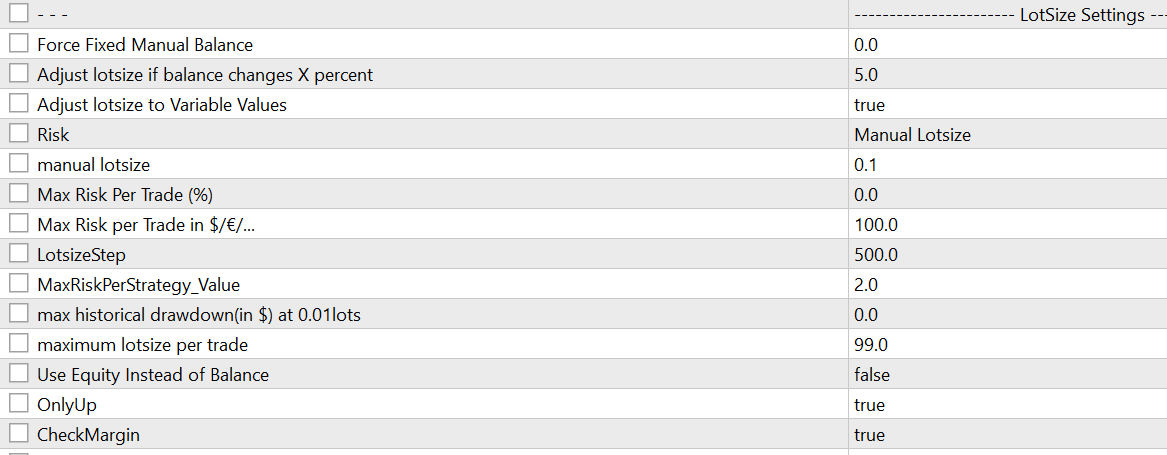
Lotsize Settings: for optimization process, I only use FIXED lotsize (manual lotsize), at minimum lotsize of 0.01lots for forex pairs. The reason being that it will make the process of comparing strategies much easier. I like to know what the drawdown and profits are in \$ value, at this lotsize. So, for example, if a strategy has a 200\$ max drawdown at 0,01lots, I know that I need to run at 0,01lots on a 2000\$ account to keep drawdown below 10%. I don’t use the lotsize settings during my optimization process. If you are optimizing for markets that go up over time, like Gold, Indices, Bitcoin, it’s recommended to set a fixed lotsize to 0.1lots, BUT enable “Adjust Lotsize to Variable Values”. And then, after the optimization, divide the max historical drawdown from the backtest, by 10 (to link it to 0.01lots)
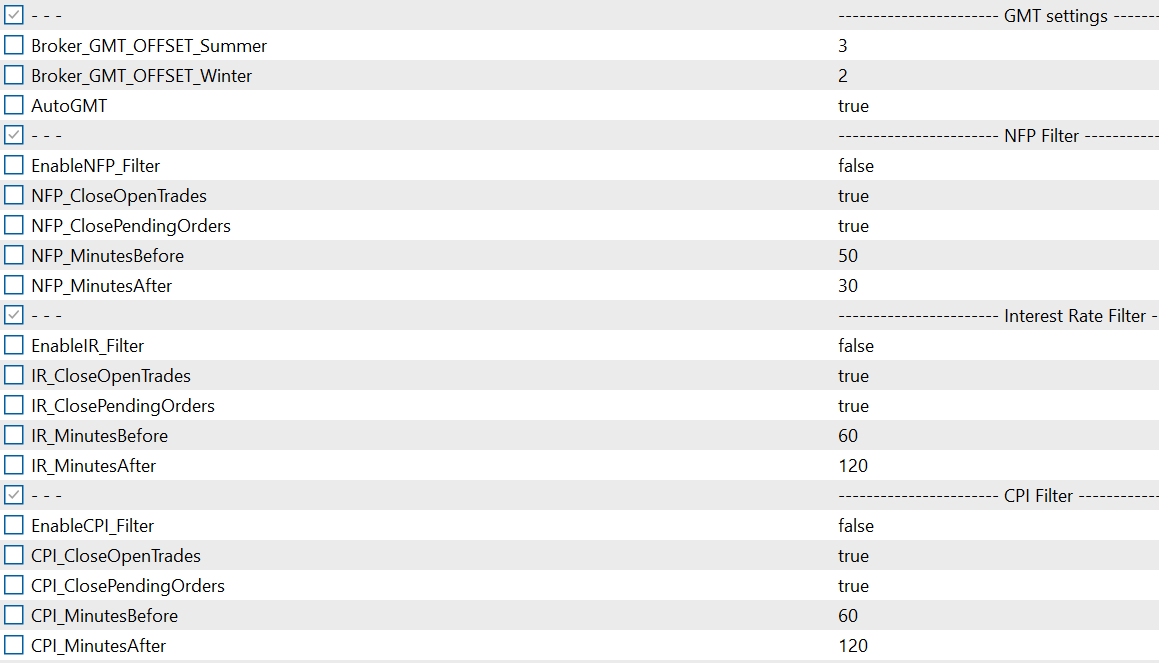
GMT settings and news filters: Not used during optimization process, but I do check to see the impact of them on the strategies that came out of my optimizations. We want it to have as little as possible negative impact on the performance of the strategy, because else it would mean that the profits from the strategy are based on the movements around these news events. And there is a big chance that live trading will be different, since these events can cause big slippage which isn’t affecting our backtests.
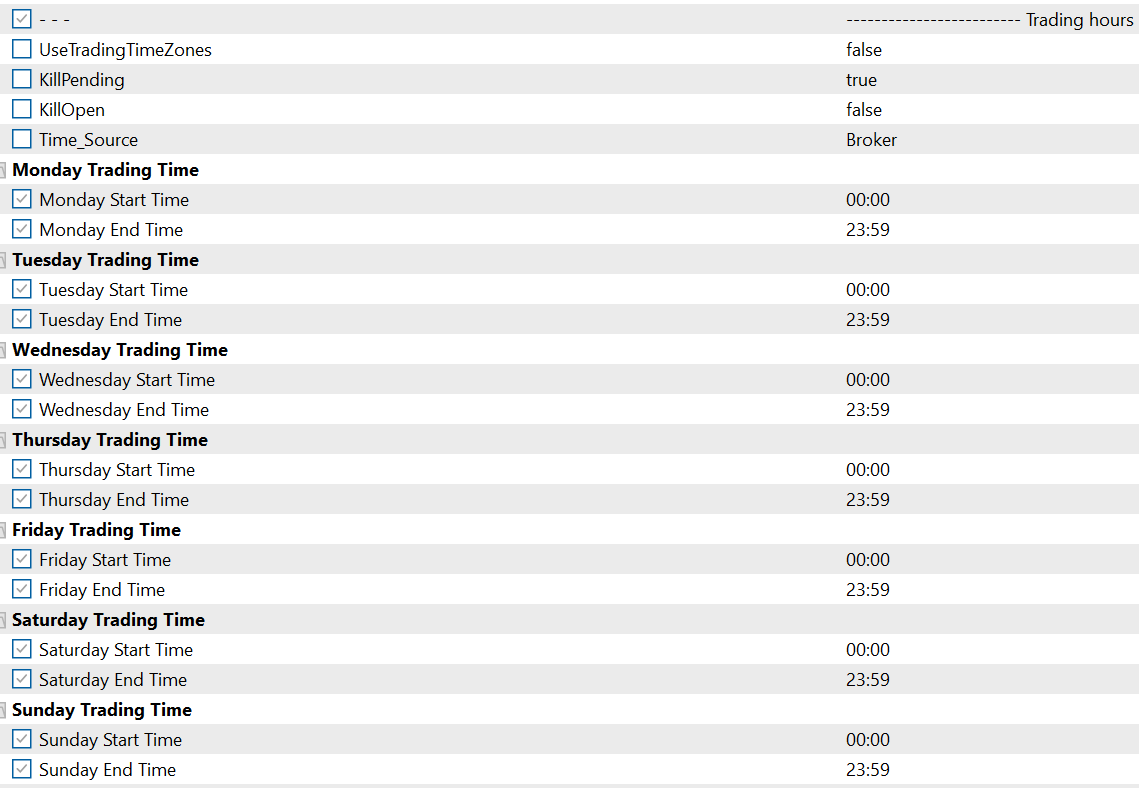
Trading hours: These can be used to have the EA trade only between certain moments of the day. I don’t use these parameters often, and not during optimizations (unless you might have a specific intraday strategy in mind ofcourse, that requires these).
Optimization of the Volatility Breakout System
All exit optimization settings can remain the same as with the breakout of support and resistance
For entry optimization, we can use the setting like below:
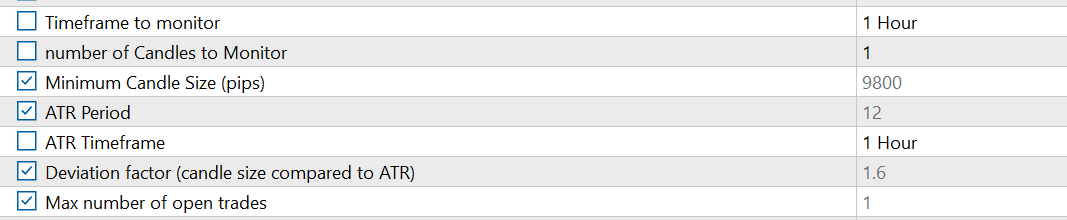
I would keep the the Timeframe to monitor and ATR timeframe in the beginning the same. That’s the most logical. Also, number of candles to monitor, I would keep at 1 at the start.
The minimum candle size depends on the market you are optimizing for, but for example on EURUSD, I would use values from 20 to 70 pips, with steps of 5
ATR Period: from 5 to 50, steps of 1
Deviation factor: from 1.5 to 3.5, steps 0.1
Max number of open trades: I would keep at 1 to start
Running the optimization
Now it is time to start the first optimization process!
The overall process of finding a strategy that I will use on live accounts can be summarized like this:
- Run the optimization process on a bigger period (for example
2013-2023), using 1M OHLC for modelling
- Run a 2024-2025 backtest using “every tick using real ticks” as a
first out-of-sample test, which will also confirm if the 1M OHLC modelling is good enough for further processing of the strategy
- Run another out-of-sample test on a bigger period (2000-2013). This
should be quite in line with the optimized period’s performance.
- You could also first do the 2000-2013 out of sample test and then the
2024-2025 real tick test... whatever feels more logical to you.
- Run specific further optimizations on individual parameters (for
example: stoploss and takeprofit, Break-even settings, Trailing TP settings.
- Redo out of sample and “every tick using real ticks” stress tests
- Optional: run other stress tests, like different symbol, timeframe,
changing up some parameters
- Save the strategy and do the same for the next one.
- Compare all final strategy in Quant Analyzer and make final decision
on which one are the best ones to use on demo/live trading
I personally always use the MQL5 Cloud service for running optimizations, since it will greatly improve the speed in which you will get your results.
You can enable them by going to the “agents” tab, right clicking in it, and enabling the MQL5 Cloud network.
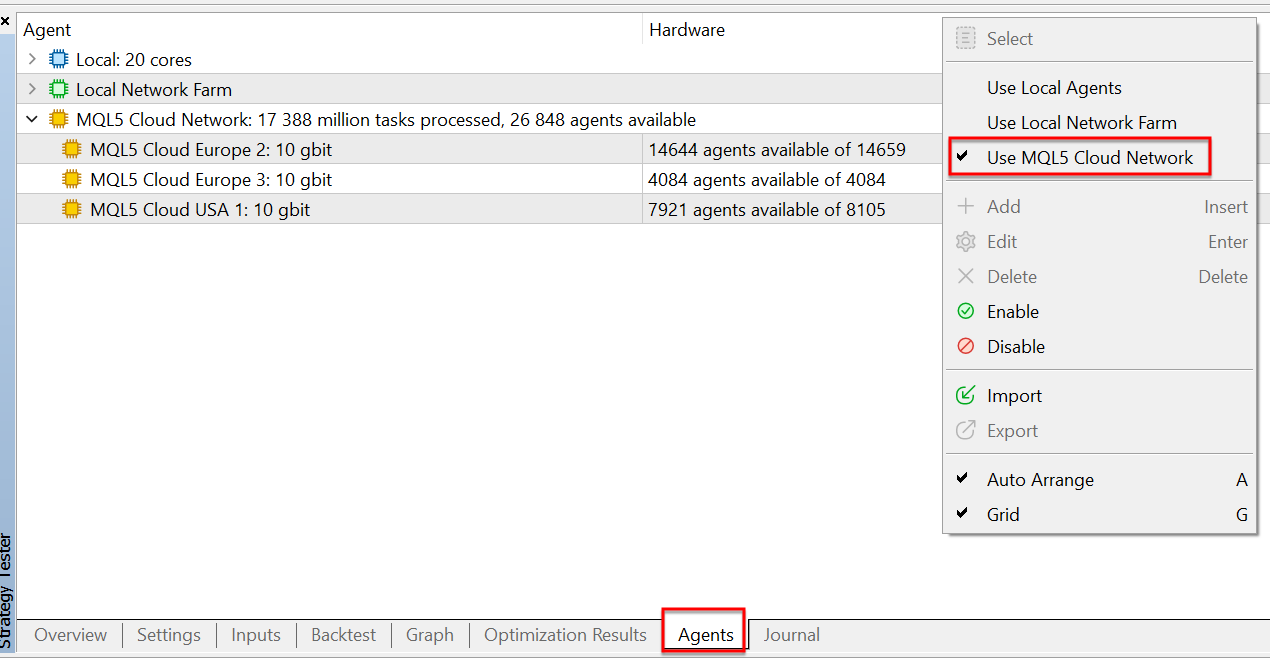
Now press “start” in the “Settings” Tab and let the process run till the end
Once we have our results, I like to go through them and sort them in different ways and then run some tests on those that look interesting.
For example, I first simply sort on “results” column, as this uses the combined criteria parameters of the “custom max” parameters, which are the “recovery factor”, “Expected Payoff”, and “number of trades”. And then I will run some quick backtests on some of the top-ranking strategies (simply double click the optimization results). Just to see how the growth curve looks. We want a strategy that look linear in growth.
Then I will sort for example on “recovery rate” and/or “max drawdown”, as this will have a different ranking. And try to find some other interesting strategies. The idea is that we try to find different strategies that have a different growth curve. It makes no sense to collect only strategies that all look the same. We are trying to find strategies that can be used together in a portfolio. Because, that way, we’ll spread the risk and end up with a more stable growth curve overall.
It’s a good practice to run a backtest on a variety of different results from the optimization process. If you see something that you like, simply save the set file, and save the backtest result. These will be part of the first selection of strategies. Sometimes, I can easily find multiple interesting strategies from 1 optimization process, but sometimes I need to run several optimizations (using different values regarding for example optimization-period, timeframe, and enabling/disabling some of the parameters for optimizations).
Once you have found a bunch of strategies that are worth looking into, we’ll be doing some more extensive tests on these, including “every tick using real ticks” tests and out of sample tests.
“Every Tick using real ticks” test: once I found some results, that look good on my 2013-2023 (example) period, I will my first stress test on 2024-2025, using “every tick using real ticks”. Not only do I want to see if it is in line with longer period backtest, but I will also check and compare it with the “1Minute OHLC” test of that same period.
If it is comparable, I will assume that I can use 1Minute OHLC for doing more testing, including the 2000-2013 out of sample stress-test. This is to make sure that the strategy isn’t over-optimized for the 2013-2023 period.
Once this check has been done, I will often do some individual optimizations for some of the parameters. For example, I might run an optimization for the trailingSL options that I didn’t use yet, like the High/Low trailingSL. This is to see if I can reduce drawdown and/or increase profits for the strategy. I might also run an optimization again on other parameters, like SL/TP, trailing SL, or even some entry criteria. Just don’t run too many together in these re-optimizations, as it will create completely different results from your initial strategy.
After I did these individual optimizations, I will recheck the strategy with “every tick using real ticks” and also the out-of-sample stress test. Just to make sure it is still valid and didn’t become over-optimized.
At this point, I consider the strategy a valid one. So I will save it, and go on to the next one of my initials optimization results. Sometimes, I will do some extra stress tests, like running the strategy on a different market and/or timeframe. A working strategy on EURUSD for example, should not give absolutely horrible results on GBPUSD, as they are quite correlated currency pairs. The indices optimizations that I did for Indicement EA, for example, showed very good stability when doing cross-pair tests, which made me confident about their robustness.
So, after I did a bunch these “strategy creating” steps, I will load them all into Quant Analyzer, and compare them. Here I will make my final decision on which strategies I will use, and which ones I will discard. Some of them will look quite the same, so I will choose only one of those similar looking ones. Best case scenario, you have found some uncorrelated ones, that can be run together and create a smoother overall growth curve. This can be seen in my products like Goldtrade Pro for example, where the EA runs 8 strategies, all of which have a different growth curve. And this creates a more stable overall growth.
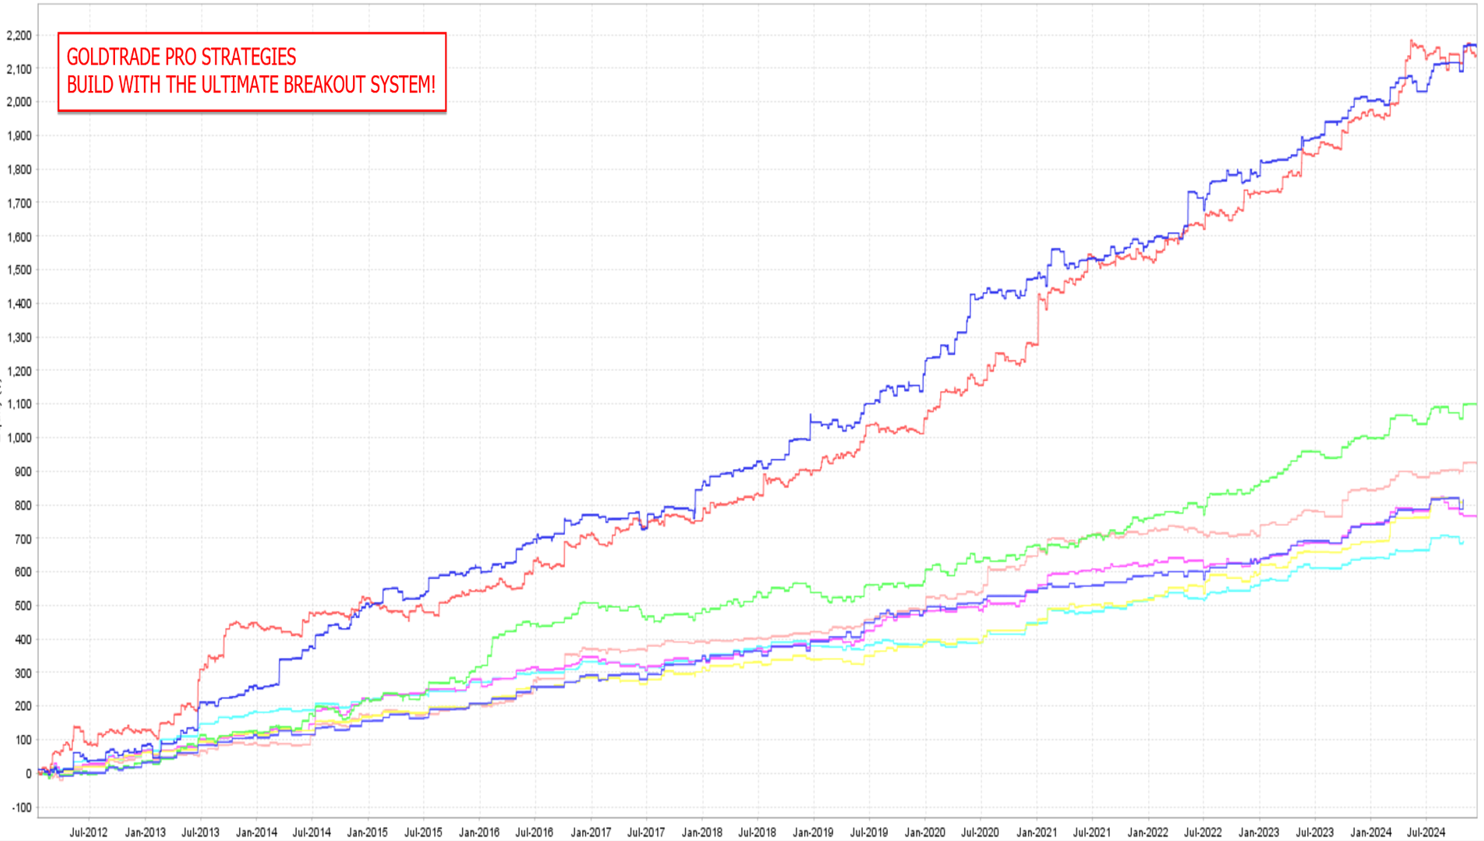
Next step would be, ideally, to do the entire process again on another market.
Once we have a bunch of strategies, for different markets, we can add them all together again in Quant Analyzer, and see how the portfolio would look like. Once you have a nice portfolio, you can start deploying them on a demo account (or live). The next few days/weeks, after deploying them, it is important to keep comparing the live trade results, with the backtest of that same period. This is to validate again, that the strategy is valid, and that the backtests can be trusted as a guideline of what to expect in live trading.
Parameter Reference
This section covers every setting in the Expert Advisor, in the order the settings appear in the Inputs tab. Setting names are written exactly as they appear on screen.
Values expressed in pips are scaled by the Variable Values system when that is switched on. Times are broker server time unless a setting says otherwise.
Before anything else
The EA contains three entry models, and only one runs at a time. You choose it with Run_Strategy in Other Settings.
| Model | How it enters |
|---|---|
| Breakout Support/Resistance | Finds recent highs and lows that stand out, and places pending stop orders just beyond them. |
| Volatility Breakout | Compares recent candle size against ATR, and enters when a move is unusually large. |
| Model | How it enters |
|---|---|
| Range Breakout | Measures a range at a set time each day and trades the break of it. |
Everything that happens after entry — stop loss, take profit, trailing, break-even, grid, filters, lot sizing — is shared by all three. Those sections apply whichever model you pick.
1. Licence Key
Only relevant to the version of the EA sold outside the MQL5 Market.
| Setting | What it does |
|---|---|
| URL to Add | The address that must be allowed in MetaTrader for licence validation. |
| LICURL / LICURLB | A reminder of where to add it: Tools → Options → Expert Advisors. |
These are on-screen instructions rather than settings. Nothing here needs changing.
2. InfoPanel Settings
The info panel is the display drawn on the chart showing what each running set is doing.
| Setting | What it does |
|---|---|
| ShowInfoPanel | Shows or hides the panel. |
| Update infopanel during testing | Also draws it during backtests. |
| Adjustment for Infopanel size | Scales the panel for your screen. Default 1. |
| Force Font Size | Overrides the panel font size. 0 lets the EA choose. |
3. AutoLoad Set Files (OneChartSetup)
This is how you run many strategies from a single chart. Each strategy lives in its own .set file, with its own symbol, timeframe and settings, and the EA loads them all.
| Setting | What it does |
|---|---|
| UseAutoLoader | Turns multi-set mode on. When off, the EA uses only the settings in this dialog. |
| Max strategies shown at once | How many strategy rows the info panel draws before it needs scrolling. Roll the mouse wheel over the panel to reach the rest. Default 30. |
| Folder with .set files | Folder inside MQL5\Files\ holding the set files. |
| Override Autoload Lotsize Settings | Ignore the lot-size settings inside every set file and use the ones in this dialog instead. |
| Setting | What it does |
|---|---|
| Override Autoload Newsfilter settings | The same, for the news filters. |
| Override Autoload Trading Time settings | The same, for trading hours. |
| Override Autoload Prop Firm Settings | The same, for the prop firm limits. |
| Force Max Pending Order Per strategy | Caps pending orders per set. 0 = no cap. |
Why the Override switches exist
They let you change one thing across every strategy without editing twenty files. The usual case is running all your sets at a single fixed lot size to compare them fairly, or switching every set's news filter on at once.
Speeding up backtests
Force Max Pending Order Per strategy set to a low number such as 2 noticeably speeds up a multi-set backtest, and usually changes the result very little. It is a testing convenience, not something to leave on when trading.
Group closing
Everything above treats each strategy separately. Group closing is the exception. It watches the combined open profit or loss of every strategy on the chart and, once that total reaches a level you set, closes all of their open trades in one sweep.
| Setting | What it does |
|---|---|
| Group Close: combined open PROFIT that closes all | The total floating profit, across all strategies, that closes everything. 0 switches it off. |
| Group Close: trail the profit target by this give-back | Turns the profit target into a trailing exit instead of a fixed one. 0 closes at the target. |
| Group Close: combined open LOSS that closes all | The total floating loss that closes everything. Enter it as a positive number. 0 switches it off. |
| Group Close: unit of the three values above | Whether those three values are amounts in account currency, or percentages of your balance. |
| Group Close: also delete all pending orders | Deletes every pending order at the same time. Off by default, so the pending orders survive and can still trigger afterwards. |
| Group Close: stop trading after a group close | Stops the EA opening anything new after a sweep. Off by default, so the strategies simply carry on. |
Each of the three values works on its own and each is switched off with 0, so you can run a profit target with no loss limit, a loss limit with no profit target, or both. With all three at 0 the feature does nothing at all.
Currency or percent
Unit applies to all three values together. In currency mode they are plain amounts: a profit target of 200 means 200 in your account currency. In percent mode they are percentages of the balance your strategies are actually sized from — the same figure the lot-size calculation uses, so a Force Fixed Manual Balance or the OnlyUp high-water mark is respected rather than the raw account balance. Where sets disagree, the largest of those figures is used.
The measurement is open profit and loss only, including swap. It has nothing to do with the P&L columns on the info panel, which show closed trades.
Trailing the group profit
Left at 0, trail the profit target does nothing and the profit target closes everything the moment it is reached. Set above 0 it changes what the target means: reaching the target no longer closes anything, it starts a trail. The EA then remembers the highest combined open profit from that moment on and closes everything once the open result gives back the trail distance from that peak.
The trail distance is measured the same way the target is, so in percent mode both are percentages of the same balance. With a target of 10% and a trail of 2% on a 10,000 balance, nothing closes until open profit reaches 1,000. If it stalls there and slips back to 800, everything closes. If instead it runs on to 1,500, the exit follows it up to 1,300.
What group closing leaves alone
Only positions belonging to the loaded set files are counted and closed. Trades you placed by hand, and trades from any other EA on the account, are neither measured nor touched.
Group closing also works with UseAutoLoader off, where it simply applies to the single strategy in the dialog.
4. Custom Optimization Settings
These discard optimisation passes that fail your criteria, so the results table only contains variants worth looking at.
| Setting | What it does |
|---|---|
| expected payoff | Minimum expected payoff a pass must reach. 0 disables. |
| recovery factor | Minimum recovery factor. 0 disables. |
| Minimum number of trades | Discards passes with too few trades. |
| Maximum number of trades | Discards passes with too many. 0 disables. |
5. Spread Filter
Stops the EA opening trades when the spread widens beyond normal, and resumes when it settles.
| Setting | What it does |
|---|---|
| SpreadFilter | Turns the filter on. |
| MaxSpread | The spread above which trading is suspended. |
| DistForSpreadFilter | Distance used to decide whether pending orders sitting close to the market should be pulled while the spread is wide. |
This matters most around news and at the daily rollover, when spreads on many instruments briefly multiply. A pending order sitting a few pips from price can be triggered by a spread spike alone.
6. Backtest Speed Settings
| Setting | What it does |
|---|---|
| Backtest Speed | normal, efficient, fast, or ultra fast. Faster modes skip ticks. |
Use normal for any result you intend to act on. The faster settings are for a first rough look while developing an idea, when you only need to know whether something is worth testing properly.
7. Other Settings
This section holds the identity of the EA instance and a few global behaviours.
| Setting | What it does |
|---|---|
| Magicnumber | Identifies this EA's trades. Must be unique per chart and per set file. |
| Comment for trades | Text attached to every order, visible in the terminal. |
| ForceSymbol | Trades a different symbol than the chart's. Must match the broker's symbol name exactly. |
| Disable ForceSymbol during single setup | Ignores ForceSymbol when the AutoLoader is off, so a single chart always trades its own symbol. |
| Set SL/TP after entry | Sends the order without stops and adds them immediately after the fill. |
| Use virtual expiration | The EA expires pending orders itself instead of asking the broker to. |
| Use Virtual SL | OFF, STANDARD, or ALL EXCEPT BE. Keeps stops inside the EA rather than at the broker. |
| Hard SL distance when using virtual SL | A real stop placed this far beyond the virtual one, as disconnection protection. |
| Move hard SL to virtual SL after X seconds | Converts the protective stop into the real stop after a delay. 0 disables. |
| Run_Strategy | Which of the three entry models runs. |
| AllowBuyTrades | Permits long entries. |
| AllowSellTrades | Permits short entries. |
| PrintLogs | Writes operational detail to the Experts tab. |
When to use "Set SL/TP after entry"
Some brokers reject an order that arrives with a stop and target already attached. Switching this on sends the order bare and adds the levels a moment later. If your orders are being rejected for no obvious reason, try this first.
Virtual stops
A virtual stop is held by the EA, not by the broker, so it is not visible on the server. The cost is that a virtual stop cannot
trigger while your terminal is not running.
That is what the hard SL distance is for: a real stop placed further away, which only ever fires if something has gone wrong. Always set one when using virtual stops on a live account.
8. Variable Values Settings
This is the mechanism that lets one set of pip distances work across different instruments and through changing volatility. Every distance you enter in pips is multiplied by a factor derived from a long-period ATR.
| Setting | What it does |
|---|---|
| Default ATR value | The reference ATR that current conditions are compared against. 0 disables scaling. |
| ATR Period | Period of the ATR used for that comparison. Default 30. |
| ATR Timeframe | Timeframe of that ATR. Daily is the usual choice. |
| Default price for calculation | Reference price, so the same settings keep working as an instrument's price level changes over the years. |
What this changes
With Default ATR value at 0, every pip setting in the EA means literally what it says. A 250-pip stop is 250 pips.
Once it is set, the same 250 becomes "250 pips, scaled to current conditions" — wider when the market is moving more than the reference, tighter when it is quiet. A strategy tuned in a calm month then still behaves sensibly in a volatile one.
Entry Models
Only the model chosen in Run_Strategy is active.
9. Volatility Breakout Entry
This model enters when recent candles are unusually large compared with the ATR. The reasoning is that a sudden strong move is more likely to continue than to reverse.
| Setting | What it does |
|---|---|
| Timeframe to monitor | Timeframe whose candles are measured. |
| Number of candles to monitor | How many consecutive candles are combined to measure the move. Default 1. |
| Minimum candle size (pips) | A floor on the move, so a tiny candle cannot qualify in a very quiet market. 0 disables. |
| ATR Period | Period of the ATR used for comparison. Default 21. |
| ATR Timeframe | Timeframe of that ATR. |
| Deviation factor | How many times the ATR the candle must exceed before entry is allowed. Default 2.4. |
| Max number of open trades | Simultaneous trades permitted in the same direction. |
Setting the deviation factor
This is the main dial.
| Value | Result |
|---|---|
| 1.5 – 2.0 | Fires on ordinary strong candles. Many trades. |
| 2.2 – 2.8 | Balanced. A good starting range. |
| 3.0 and above | Only genuinely exceptional candles. Few trades. |
Why the minimum candle size exists
The ATR test is relative, so in a very quiet market a move of 2.4 × a tiny ATR is still a tiny move — not worth trading once spread and commission are paid. The minimum candle size puts an absolute floor underneath the relative test.
10. Breakout Support/Resistance Entry Model
This model finds recent highs and lows that stand out from the candles around them, then places pending stop orders beyond those levels.
| Setting | What it does |
|---|---|
| Entry model | entry at breakout places a stop order beyond the level. entry at retest after breakout waits for price to come back to the level after breaking it. |
| Trigger point of Break/Retest strategy | How far past the level price must go before the retest order becomes active. |
| Expiration (hours) for limit order | Lifetime of the retest limit order. 0 = no expiry. |
Breakout or retest?
Entry at breakout takes every break, including the ones that fail immediately. You are in the move from the start, and you pay for that with false breaks.
Entry at retest waits for price to return to the level it just broke. Fewer trades, better prices, and a natural stop location — but the breaks that never look back are missed entirely, and those are often the strongest ones.
Neither is better in general. Test both on the instrument you intend to trade.
11. Breakout Support/Resistance Entry Setup
| Setting | What it does |
|---|---|
| Timeframe to use | Timeframe on which highs and lows are located. |
| Entry Timing | How often the EA checks for new signals. |
| Number of inferior candles to the LEFT of High/Low | How many lower highs (or higher lows) must sit to the left of a level for it to count. |
| Number of inferior candles to the RIGHT of High/Low | The same, on the right. |
| Max candles in history to look at | How far back the EA searches for levels. Default 250. |
| Setting | What it does |
|---|---|
| Minimum distance away from High/Low | Minimum distance in pips between price and a level before an order is placed there. |
| Minimum distance away in percentage | The same, expressed as a percentage. 0 uses the pip value instead. |
| Extra pips above High for entry | How far beyond the high the buy stop sits. |
| Extra pips below Low for entry | How far beyond the low the sell stop sits. |
| Maximum number of pending orders | Pending orders allowed at once. |
| Max number of open trades | Open trades allowed at once. |
| Minimum distance between orders | Stops several pending orders clustering at nearly the same price. |
| Expiration time (in hours) for pending orders | Lifetime of an unfilled pending order. |
The two most important settings
Number of inferior candles to the LEFT and RIGHT define how prominent a high or low must be before the EA treats it as a level.
| Value | Result |
|---|---|
| 1 – 2 | Many minor levels. Frequent trades. |
| 3 – 5 | Fewer, more significant levels. |
| 6 and above | Only major structure. Rare trades. |
These are the natural first thing to optimise in this model, because everything else follows from which levels get found.
Why the minimum distances matter
If price has already travelled most of the way to a level, there is no room left for the setup to work — you would be buying a breakout that has effectively already happened. Minimum distance away from High/Low prevents that.
Use the percentage version instead when trading instruments whose price level varies enormously, where a fixed pip distance means something different at 1,000 than at 40,000.
12. Range Breakout: Range Determination
This model performs a single check at a set time each day. It measures the range that formed just before that moment and, if the range is tight enough to qualify, trades the break of it.
If the market was too volatile during that window, the range is rejected and no trade is taken that day. That filter is the point of the model — it skips the days when price was not genuinely consolidating.
| Setting | What it does |
|---|---|
| Timeframe to monitor | Timeframe whose candles are measured. Independent of the chart. |
| Min candles to qualify as a range | How many candles are measured before the check time. On M15 with 12, the EA looks back three hours. |
| Setting | What it does |
|---|---|
| Max candles a range may extend | Upper limit on range length. Keep at roughly five times the minimum. |
| ATR period (range height yardstick) | Period of the ATR used as the height yardstick. Default 14. |
| ATR timeframe | Timeframe of that ATR. |
| Max range height (x ATR) | The main dial. The largest height still accepted as a range. |
| Max range height (pips) | Optional hard ceiling in pips. 0 disables. When both are set, the tighter one applies. |
| How to measure the range | High/Low (wicks) is stricter — one long wick can disqualify the window. Open/Close (bodies) tolerates spikes. |
Why the height limit is in ATR
ATR measures how much the instrument is currently moving. Expressing the limit as a multiple of it keeps the same setting sensible in quiet and busy markets, and lets it transfer between instruments without retuning.
Setting "Max range height (x ATR)"
| Value | Result |
|---|---|
| 0.8 – 1.2 | Only very tight ranges accepted. Few trades, high quality. |
| 1.3 – 1.8 | Balanced. A good starting point. |
| 2.0 – 2.5 | Loose. More trades, more marginal ones. |
| 4.0 and above | The filter is effectively off. |
13. Range Breakout: Invalidation and Entry
The first two settings decide when a range stops being valid. They do not set your entry price.
| Setting | What it does |
|---|---|
| Breakout buffer (x ATR) | How far past the edge price must travel before the range counts as broken. Noise tolerance. |
| Break confirmation | Whether that needs a candle to close beyond the edge, or whether a wick through it is enough. |
| Timezone for the check time | Broker server time, New York time (follows US DST), or London time (follows EU DST). |
| Hour to check the range | Hour, in the timezone above. |
| Minute to check the range | Minute of that hour. |
| How to enter the breakout | Pending buy stop / sell stop at the range edges, or Market entry on a candle closing outside the range. |
| Extra pips above range TOP for buy entry | Distance beyond the upper edge. |
| Setting | What it does |
|---|---|
| Extra pips below range BOTTOM for sell entry | Distance beyond the lower edge. May differ from the buy side. |
| Time (minutes) for entry-window | How long the setup stays tradable after the check time. 0 removes the limit. |
| Max open trades per direction | Simultaneous open trades in the same direction. |
| Delete opposite pending once one fills (OCO) | Once one side triggers, the other is cancelled. Leave this on. |
Following a session open
Set the timezone to the exchange's own city and the EA follows daylight saving automatically:
Timezone for the check time = New York time (follows US DST)
Hour to check the range     = 9
Minute to check the range   = 30
This stays correct all year. The United States and Europe change their clocks on different dates, so for a few weeks twice a year a fixed broker-server hour would be an hour away from the actual open.
Pending or market on close?
Pending enters during the breakout at a known price. A single spike through the edge can fill you on a move that immediately reverses.
Market on close waits for a candle to finish outside the range, which filters out those spikes. You enter later and at a worse price in exchange.
Neither is better in general. Test both.
The entry window
Time (minutes) for entry-window limits how long a setup can still trigger. With 240, a range measured at 09:30 stops being tradable at 13:30 whether or not it broke. Without it, an unfilled setup could trigger many hours later on a move that has nothing to do with the morning's range.
14. Range Breakout: Exit Parameters
| Setting | What it does |
|---|---|
| Close trades at this hour | Closes any open range trade at this time. -1 = never. |
| Close trades at this minute | Minute of that closing time. |
| Initial SL placement | Use the standard initial stoploss distance, or Beyond the opposite side of the range. |
| Pips beyond the opposite side | Used only in opposite-side mode. |
| Takeprofit as a multiple of the stoploss distance | 0 uses your standard initial takeprofit distance. |
Closing on time
The closing time uses the same timezone as the check time, so setting New York makes both entry and exit follow US daylight saving together. At that moment the EA closes any open range position and cancels anything still waiting to trigger.
Timezone for the check time = New York time
Hour to check the range     = 9      (measure at the open)
Close trades at this hour   = 15
Close trades at this minute = 55     (flat before the cash close)
Using the opposite-side stop
A buy triggered above the range has its stop below the range, and a sell the reverse. The stop then sits where the trade idea is actually proven wrong, which is often more logical than a fixed distance.
The trade-off is that your stop distance now changes with every setup, because it depends on how wide that day's range turned out. A fixed takeprofit distance would then give a different reward-to-risk on every trade.
That is what the takeprofit multiple is for:
Initial SL placement                       = Beyond the opposite side of the range
Pips beyond the opposite side              = 10
Takeprofit as a multiple of the stoploss   = 2
Choose a risk-based lot size with this stop mode
With a variable stop it is worth changing how position size is decided as well. Under Manual Lotsize every trade uses the same number of lots, so a trade stopping out beyond a wide range loses several times more than one stopping out beyond a narrow range. The money at risk is then decided by whatever width the market happened to produce that day, rather than by you.
Setting Risk to use Risk Per Trade (%) or use Risk per trade in $/€ removes that. Position size is calculated from the real stop distance of each individual trade, so every trade risks the same amount whatever the range width.
The consequence is that your lot size will differ from trade to trade — smaller when the range is wide and the stop is far away, larger when the range is tight. That is the intended behaviour, not a fault: the varying lot size is exactly what keeps the risk constant. Only ranges of identical width will produce identical lot sizes.
Initial SL placement = Beyond the opposite side of the range
Risk                 = use Risk Per Trade (%)
Max Risk Per Trade   = 1
15. Range Breakout: Visuals
Boxes are drawn on the chart so you can see exactly what the EA measured — gold while forming, green when broken upward, red when broken downward, labelled with duration and height.
| Setting | What it does |
|---|---|
| Detailed logging | Full decision log in the Experts tab. Leave off for normal use. |
| Draw range boxes on chart | Turns the boxes on or off. |
| Candles of history to draw | How much past history is drawn at startup. Display only. |
| Setting | What it does |
|---|---|
| Colour: forming range | Colour of a range still forming. |
| Colour: broken upward | Colour of a range broken upward. |
| Colour: broken downward | Colour of a range broken downward. |
All drawing switches off automatically during optimisation.
Trade Management
These sections apply to all three entry models.
16. Trade Exit Settings
| Setting | What it does |
|---|---|
| Period to check/modify SL/TP | How often the EA reviews stops and targets: every tick, or M1 to H1. |
| Check every tick | Reviews on every tick regardless of the setting above. |
| Initial stoploss distance | Stop loss distance in pips from entry. |
| Initial takeprofit distance | Take profit distance in pips from entry. |
These two distances are the foundation for nearly everything that follows. Trailing, break-even and risk-based lot sizing all measure from them.
17. Trailing Stop-Loss Management
Moves the stop in the direction of the trade as it goes into profit.
| Setting | What it does |
|---|---|
| Trail SL distance | How far behind price the trailing stop sits. |
| Trail SL start distance | Profit required before trailing begins. |
| Trail SL stop distance | Profit beyond which the stop stops being adjusted. |
| Trail SL step size | Minimum improvement before the stop is moved again. |
Choosing a step size
A small step means the stop follows price closely and sends a great many modification requests. A larger step is gentler on the broker and much faster to backtest, at the cost of a slightly looser stop.
18. Trailing Take-Profit Management
Despite the name, this does not let winners run. It works the other way round: the take profit is moved towards price when the trade is going against you, so that a partial recovery closes the position instead of it running on to the stop loss.
| Setting | What it does |
|---|---|
| Trail TP start distance | How far the trade must move against you before the target starts moving. |
| Trail TP distance | How close to current price the target is then kept. |
Take a buy trade. Once price is Trail TP start distance below the entry, the EA begins lowering the take profit until it sits just Trail TP distance above the current price. Only a small bounce is then needed to close the trade, so the position is exited for a modest loss or near break-even rather than running to the full stop.
The target continues to follow price down for as long as the trade goes against you, so it always stays within reach of a recovery.
19. Break-Even Stop-Loss Management
| Setting | What it does |
|---|---|
| Breakeven start distance | Profit required before the stop is moved to entry. 0 disables. |
| Breakeven extra distance | Places the stop this far beyond entry rather than exactly on it. |
The extra distance exists so that a triggered break-even covers your spread and commission rather than leaving you slightly down on a "flat" trade.
20. High/Low Trailing Stop-Loss Settings
Trails the stop behind recent swing highs and lows instead of at a fixed distance, so it follows market structure.
| Setting | What it does |
|---|---|
| Use only until break-even | Uses this method only until break-even is reached, then hands over to the other trailing methods. |
| Timeframe | Timeframe on which swing points are located. |
| Number of candles to use | How far back to search for a swing point. 0 disables the method. |
| Setting | What it does |
|---|---|
| Number of inferior candles to the LEFT of High/Low | How prominent the swing point must be on its left side. |
| Number of inferior candles to the RIGHT of High/Low | The same, on the right. |
| Minimum distance to current price | Prevents the stop being placed too close to the market. |
| Minimum distance to last SL | Minimum improvement before the stop is moved again. |
| Extra pips distance from HIGH/LOW | Places the stop this far beyond the swing point rather than on it. |
This keeps the stop at a level the market itself has defined. It usually produces a wider stop than a fixed distance, but a more meaningful one.
21. Recovery Trailing Stop-Loss Based on Time
A fallback for trades that go nowhere: after a set time, start trailing regardless of profit.
| Setting | What it does |
|---|---|
| Trail SL start after X minutes | Minutes after entry before this trailing begins. 0 disables. |
| Trail SL distance | Distance used by this time-based trailing. |
Useful for reducing exposure on trades that neither reach the target nor the stop and simply sit there, tying up margin and risk.
22. MagicTrail Stop-Loss Settings
A tick-by-tick trailing method that follows price very closely, intended for capturing fast moves.
| Setting | What it does |
|---|---|
| MagicTrail mode | OFF, full, or Breakeven. In Breakeven mode it only moves the stop up to break-even and then stops. |
| Start of Magictrail (in pips) | Profit required before it begins. |
| Number of ticks before modifications | How many ticks of movement before the stop is adjusted. |
| Pip movement of magictrail | How much the stop moves per adjustment. |
| Extra pips for breakeven stop | Offset beyond entry when the stop reaches break-even. |
| Minutes of time delayed magictrail | Delays the method until this many minutes after entry. |
| Start distance of time delayed magictrail | Profit required once that delay has elapsed. |
Breakeven mode is the conservative way to use this: it secures the trade quickly and then leaves it alone, rather than trailing the whole way and being stopped out on the first pullback.
23. Grid Settings
Adds further positions as price moves against the first one, and manages the whole basket together.
| Setting | What it does |
|---|---|
| EnableGrid | Turns the grid on. |
| Grid start distance in pips | How far price must move against the position before the first grid trade is added. |
| Grid step distance in pips | Distance between each subsequent grid trade. |
| Grid check timeframe | How often grid conditions are evaluated. |
| Total pips for TP | Basket target expressed in pips. |
| Total profit for TP | Basket target in account currency. A value below 1 is read as a percentage of balance. |
| Max loss for SL | Basket loss limit, in currency or as a fraction of balance. 0 disables. |
| Stop trading at grid loss | Halts the EA entirely once that loss limit is hit, rather than only closing the basket. |
| Grid Multiplier | Multiplies the lot size of each successive grid trade. |
Understanding what a grid does to your results
A grid converts many small winning sequences into occasional very large losses. The equity curve looks smoother than the strategy really is, right up until the move that does not come back.
Grid Multiplier above 1 makes this dramatically worse. A value of 2 gives 0.02, 0.04, 0.08, 0.16 — classic martingale, where the position that finally breaks you is the largest one you have ever held.
24. Prop Firm Settings
Equity limits intended for funded-account rules.
| Setting | What it does |
|---|---|
| Close all trades/stop trading at min equity | Closes everything and stops if equity falls to this value. 0 disables. |
| Close all trades/stop trading at max equity | The same on the upside, for locking in a passed profit target. |
| Max Daily Drawdown | Closes all trades and suspends trading for the rest of the day once the day's drawdown reaches this figure. |
| Max Randomization pips for entry and exit | Adds or subtracts a random number of pips from entry and exit levels. |
Why randomisation exists
When many users run identical settings on the same instrument, the resulting orders look like copy trading to a prop firm's monitoring. A few pips of randomisation on each set makes the pattern less identical without changing the strategy in any meaningful way.
Risk, Filters and Timing
25. Lot-Size Settings
The Risk dropdown chooses the sizing method. The other settings supply whatever that method needs, so most of them are only relevant to one or two of the choices.
| Setting | What it does |
|---|---|
| Risk | The sizing method. See below. |
| manual lotsize | The fixed size, used by Manual Lotsize. |
| LotsizeStep | Balance increment that adds 0.01 lots, used by Lots per balance. |
| Max Risk Per Trade (%) | Percentage of the account risked per trade. |
| Max Risk per Trade in $/€ | Cash amount risked per trade. |
| MaxRiskPerStrategy_Value | Target risk percentage for the whole strategy. |
| max historical drawdown (in $) at 0.01 lots | The strategy's worst historical drawdown at minimum size. |
| Force Fixed Manual Balance | Sizes from this figure instead of the real balance. 0 uses the account balance. |
| Adjust lotsize if balance changes X percent | Recalculates only when the balance has moved this much, rather than on every trade. |
| Adjust lotsize to Variable Values | Scales size alongside the Variable Values system. |
| maximum lotsize per trade | Hard ceiling, whatever the calculation returns. |
| Use Equity Instead of Balance | Bases the calculation on equity, so floating losses reduce new positions. |
| OnlyUp | Size grows with the account but never shrinks after a drawdown. |
| Reset Highest Balance for OnlyUp | Clears the stored high-water balance that OnlyUp uses. |
| CheckMargin | Refuses orders the account cannot support. Leave on. |
Choosing a method
| Method | Basis |
|---|---|
| Manual Lotsize | Always the same fixed size. |
| Lots per balance | 0.01 lots for every LotsizeStep of balance. |
| Method | Basis |
|---|---|
| use Risk Per Trade (%) | A percentage of the account, measured against the trade's stop distance. |
| use Risk per trade in $/€ | A cash amount, measured against the trade's stop distance. |
| use Max Risk Per Strategy | Sized so the strategy's historical drawdown would stay inside your chosen percentage. |
Start with Manual Lotsize while testing. It keeps results comparable between runs, because a change in the equity curve is then caused by the strategy rather than by compounding.
How the risk-based methods work
They calculate from the actual stop distance of each trade, not from a nominal figure. When a strategy uses a variable stop — such as the Range Breakout's opposite-side mode — position size varies with it. That is exactly what keeps the money at risk constant.
The two settings people miss
Adjust lotsize if balance changes X percent prevents your size changing on every single trade. With 5, the calculation is only redone once the balance has moved 5%.
OnlyUp lets size grow with a rising account but never reduces it after a drawdown, so you are not shrinking your way out of a recovery.
26. GMT Settings
Used by the news filters and by any timezone-aware setting.
| Setting | What it does |
|---|---|
| Broker_GMT_OFFSET_Summer | Your broker's offset from GMT during summer time. |
| Broker_GMT_OFFSET_Winter | The same for winter time. |
| AutoGMT | Detects the broker's offset automatically in live trading. |
27. News Filter Settings
| Setting | What it does |
|---|---|
| UseMQL5Calendar | Uses the built-in MetaTrader economic calendar to find events. |
| Number of days to search forward | How far ahead the calendar is read. |
28–30. NFP, Interest Rate and CPI Filters
Three separate filters, each working the same way: suspend trading for a window around a specific kind of release.
The settings are identical in each, differing only by prefix: NFP_, IR_ for interest rates, and CPI_.
| Setting | What it does |
|---|---|
| EnableNFP_Filter / EnableIR_Filter / EnableCPI_Filter | Turns that filter on. |
| NFP_CloseOpenTrades / IR_ / CPI_ | Closes open positions before the event. |
| NFP_ClosePendingOrders / IR_ / CPI_ | Cancels pending orders before the event. |
| NFP_MinutesBefore / IR_ / CPI_ | How long before the release the filter starts. |
| NFP_MinutesAfter / IR_ / CPI_ | How long after it before trading resumes. |
Typical windows: NFP 50 minutes before and 30 after; Interest Rate and CPI 60 before and 120 after. Rate decisions get a longer tail because the press conference that follows often moves markets more than the decision itself.
31. Fake Breakout Filter
Requires a candle on one or more additional timeframes to confirm the breakout before an entry is allowed. Five independent filters are available and any combination can be used.
| Setting | What it does |
|---|---|
| Enable Filter_A … Filter_E | Turns each filter on individually. |
| Filter_A … Filter_E Timeframe | The confirmation timeframe for each. |
Each enabled filter must be satisfied, so switching on several means all of them have to agree. That removes false breakouts, but it also delays entry and removes real trades, because higher-timeframe confirmation only arrives when that candle closes.
32. Trading Hours
Restricts trading to chosen hours on each day of the week.
| Setting | What it does |
|---|---|
| UseTradingTimeZones | Turns the schedule on. When off, the EA trades at all times. |
| KillPending | Cancels pending orders when a window closes. |
| KillOpen | Closes open positions when a window closes. |
| Time_Source | Which clock the times refer to: GMT-0, Computer-VPS, or Broker. |
Each day has its own start and end time, written as HH:MM:
Monday Start / End Time    = 00:00 / 23:59
Tuesday Start / End Time   = 00:00 / 23:59
Wednesday Start / End Time = 00:00 / 23:59
Thursday Start / End Time  = 00:00 / 23:59
Friday Start / End Time    = 00:00 / 23:59
Saturday Start / End Time  = 00:00 / 23:59
Sunday Start / End Time    = 00:00 / 23:59
The defaults allow trading at any time, so the schedule does nothing until you narrow the windows.
Practical notes
Before going live
Give every chart and every set file its own magic number. Two configurations sharing one will manage each other's trades, and the symptoms are confusing.
Check the GMT offsets against your broker, particularly if you use the news filters or a timezone-aware check time.
If you use virtual stops, set a hard stop distance as well. A virtual stop cannot trigger while the terminal is closed.
Run the strategy in visual mode once before committing to it. Watching entries appear next to the levels that produced them catches configuration mistakes that no amount of reading the settings will.
Backtesting well
Use real tick data. All three entry models fill orders near a price level, and Open prices only will misreport exactly those fills — the ones the strategy depends on.
Set a minimum trade count in the optimisation filters before you start. It removes the results built on too little evidence, which are the ones most likely to look like a discovery.
Optimise in stages. Entry model first with exits held fixed, then exits with the winning entry locked in. Changing both at once makes it impossible to attribute the result to either.
Prefer a plateau to a peak. A broad group of settings that all perform reasonably is far more trustworthy than a single outstanding result surrounded by poor ones. The second is usually a curve fit.
Forward-test the winner on a period that was not part of the optimisation before trading it.